Litecoin (LTC) Price Prediction: LTC/USDT May Fall Below an Important Baseline
Estimated Reading Time: 2 minutes
Don’t invest unless you’re prepared to lose all the money you invest. This is a high-risk investment and you are unlikely to be protected if something goes wrong. Take 2 minutes to learn more
Litecoin (LTC) Price Prediction: September 3
Price action in the Litecoin daily market recently rebounded off support at the $60 mark. The market then proceeded upwards and seems positioned at a very key support level that may determine its direction.
LTC/USDT Long-term Trend: Bullish (Daily Chart)
Key Price Levels:
Resistance: $100, $120, $140
Support: $98, $96, $92
The last price candle on the LTC/USDT market has appeared just above the middle line of the Bollinger Bands (BB) indicator. This price candle indicates that downward forces are gaining strength, as it is red with a longer upper shadow. At the same time, the Stochastic Relative Strength Index (Stochastic RSI) lines are converging for a crossover just below the 80 level of the indicator.
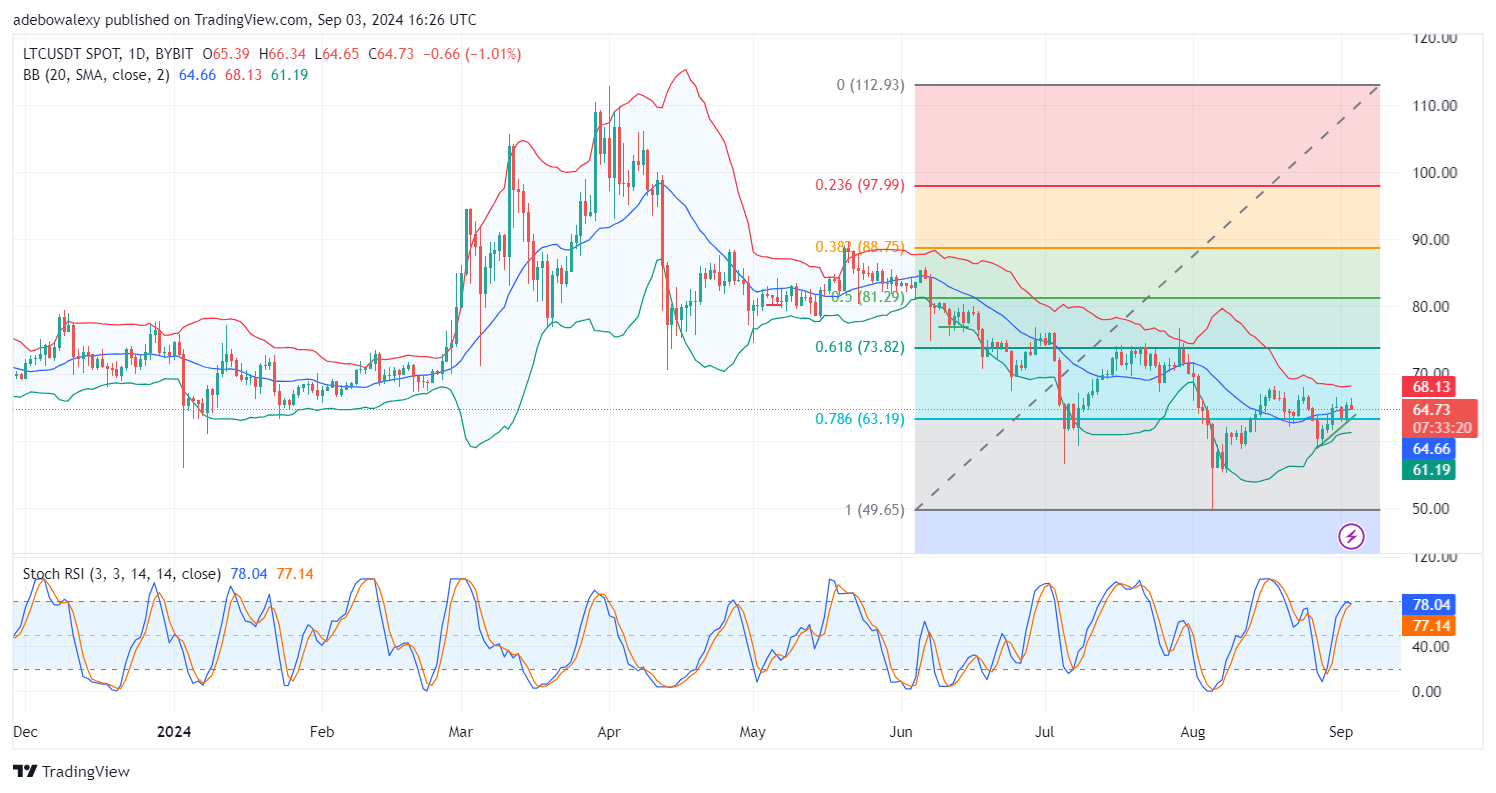
Litecoin (LTC) Price Prediction: Downward Forces Lead in the LTC/USDT Market
Price activity has generally moved upward following its rebound off the $60 mark. However, no sooner had it crossed above the middle line of the BB indicator than headwinds began to dominate. This has caused the ongoing session to fall under the control of bears, threatening a price retracement below the middle band of the BB indicator.
Additionally, the Stochastic RSI lines are converging for a crossover below the 80 level of the indicator. This development threatens continued bullish speculation as a fall below this mark may lead to stronger declines.
Litecoin (LTC) Price Prediction: LTC/USDT Bearish Odds Increase (4-Hour Chart)
The last price candle on Litecoin’s 4-hour market has breached the middle line of the BB indicator. While prices have only slightly exceeded this limit, it may signal a stronger descent. The Stochastic RSI lines are also trending downward after breaching the 80 level from above.
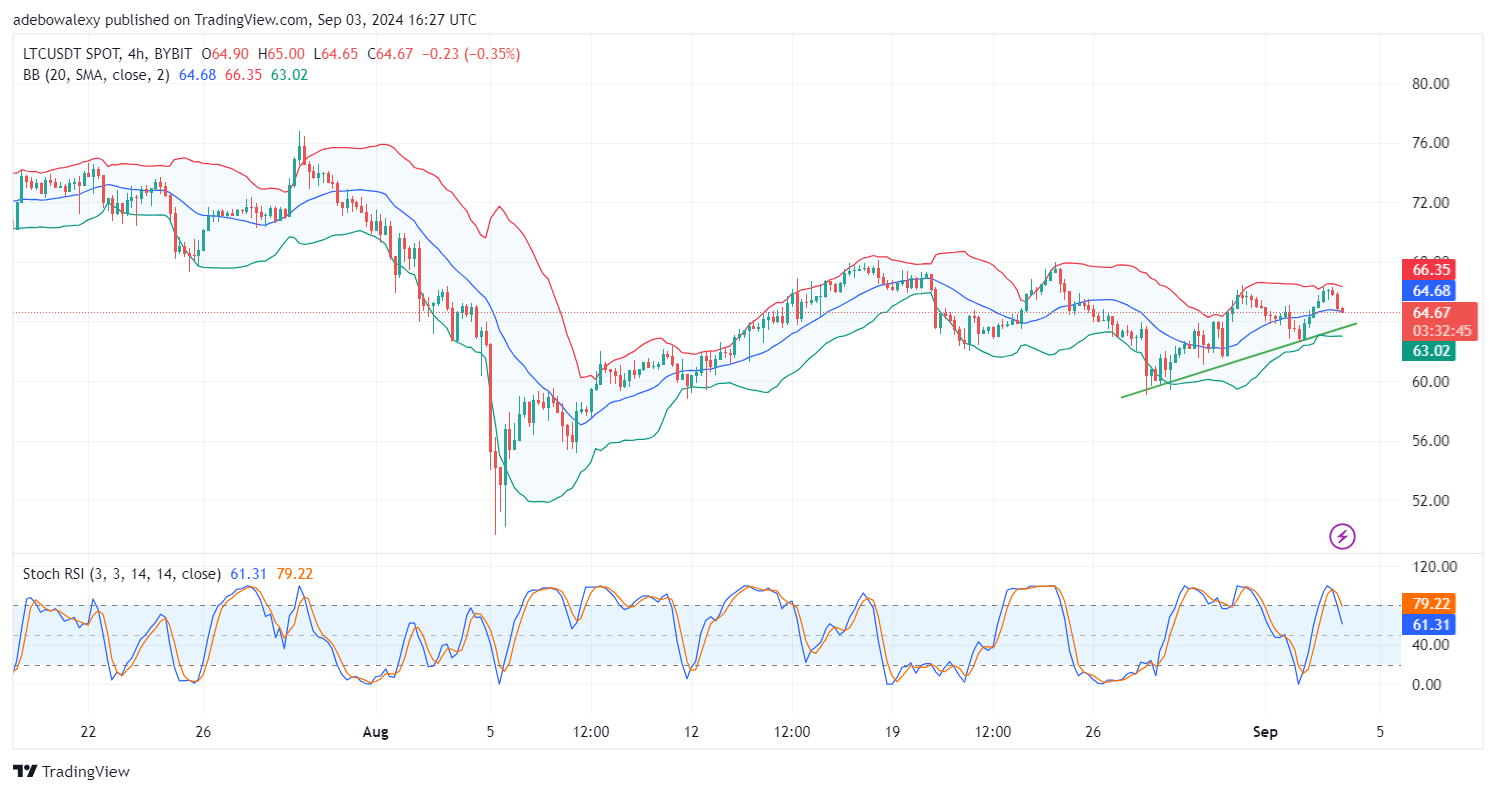
Technically, this suggests that the market will likely experience a stronger price decrease. This decline may occur despite the exaggerated movement of the Stochastic RSI lines. Should price action breach the technical price level at the $64 mark, the market may subsequently revisit the $60 baseline.