Dogecoin (DOGE) Price Prediction: DOGE/USDT Looks Very Burdened
Estimated Reading Time: 3 minutes
Don’t invest unless you’re prepared to lose all the money you invest. This is a high-risk investment and you are unlikely to be protected if something goes wrong. Take 2 minutes to learn more

Dogecoin (DOGE) Price Prediction: September 2
Dogecoin has resumed trading below the $0.1000 threshold. This occurred previously when the market experienced a significant dip that pushed it below the $0.1000 price level. Yet, this market still has the potential to descend lower as trading continues.
DOGE/USDT Long-term Trend: Bullish (Daily Chart)
Key Price Levels:
Resistance: $0.1000, $0.1200, $0.1400
Support: $0.09800, $0.09600, $0.09200
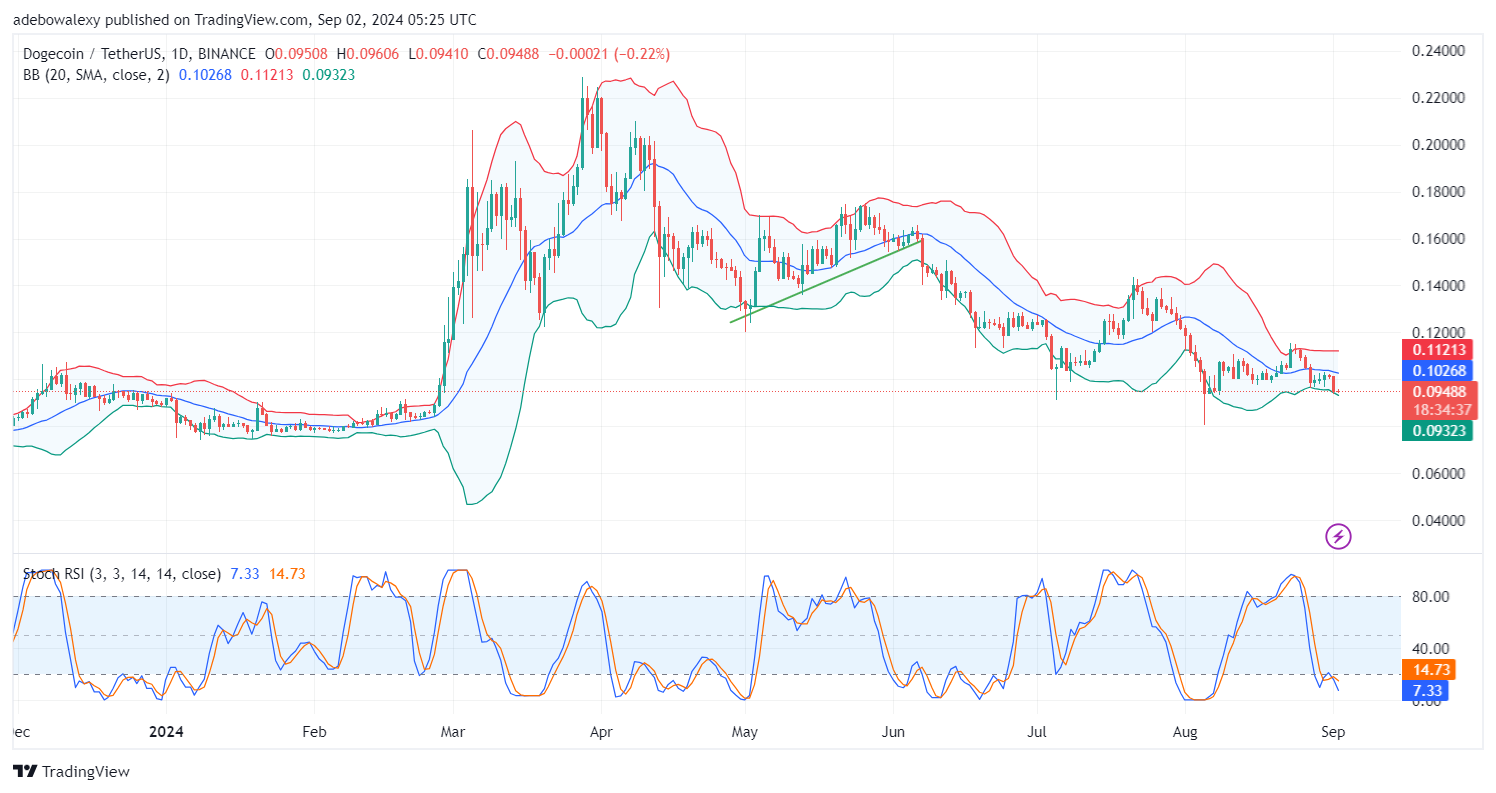
While the previous session presented bears in. The DOGE/USDT market with considerable price movement, the ongoing session, as indicated by the last price candle, reveals that bears might be facing some resistance. Nevertheless, price action is still very much around the lowest band of the Bollinger Bands (BB) indicator. Also, the Stochastic Relative Strength Index (Stochastic RSI) lines have taken a downward trajectory following a crossover in the oversold region.
Dogecoin (DOGE) Price Prediction: DOGE/USDT Seems Set to Descend Lower
Indications from technical indicators on the Dogecoin’s daily chart seem more bearishly biased. This hints that downward forces are more likely to continue propelling the market. The position of the price action below the middle limit of the BB indicator and the downward trajectory of the Stochastic RSI lines support this view.
This keeps upward momentum very much subdued at the moment.
Based on this, traders may choose to support bearish bets in this market. However, it would be valuable to gain insight into how far the downward retracement might go. Such insights can be obtained through a closer examination of price action.
Dogecoin (DOGE) Price Prediction: DOGE/USDT May Hit the $0.0900 Mark (4-Hour Chart)
As earlier mentioned, it is important for bearish traders to accurately predict how low the market may reach, and it appears that the 4-hour chart may provide such details. Here, price action continues to stay near the lowest limit of the BB indicator.
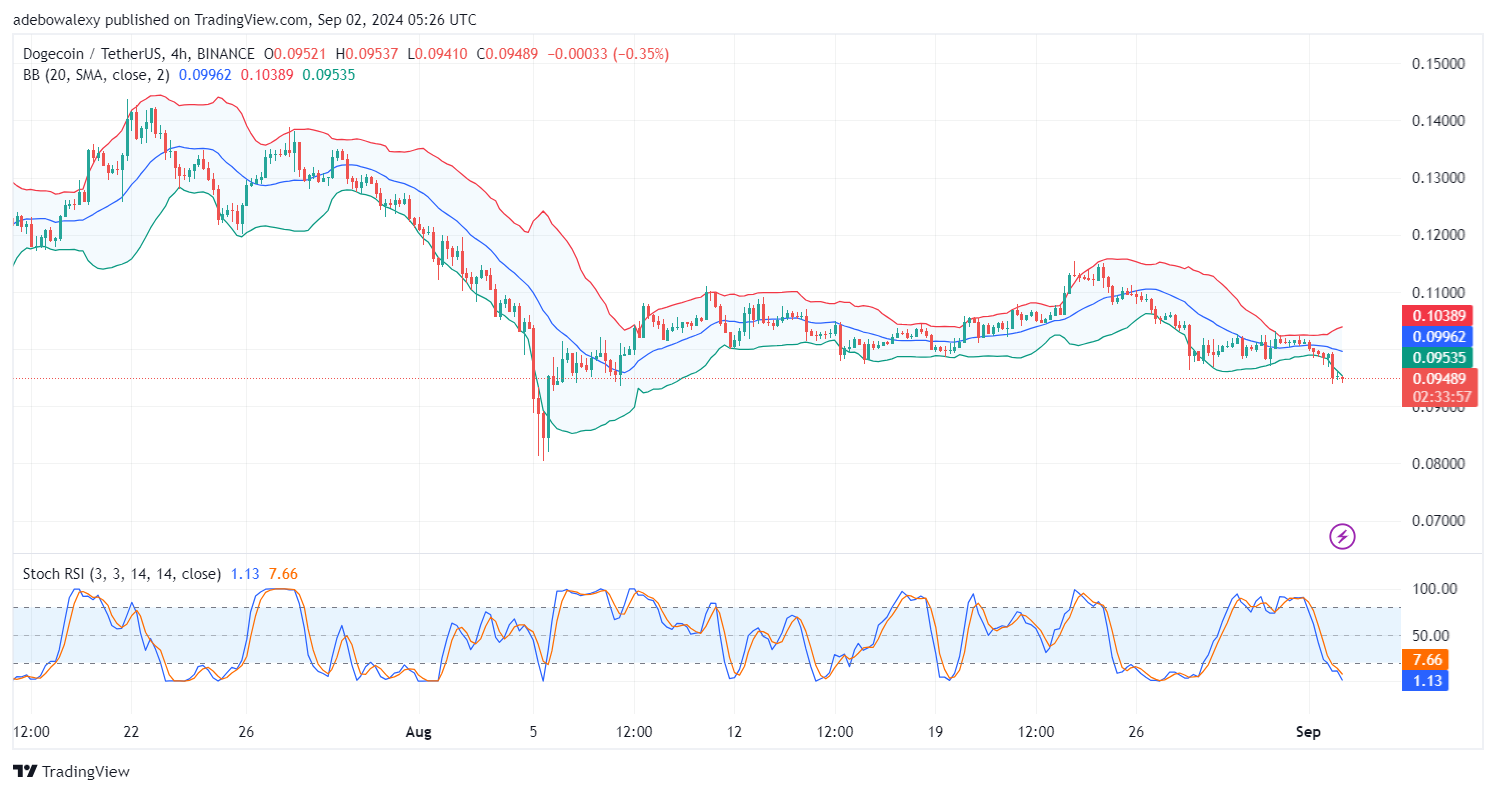
Also, the last price candle here appears solid red despite the significantly reduced volatility. The Stochastic RSI lines have maintained their downward trajectory even after reaching the oversold region. Consequently, price action now seems to be targeting the next technical support at the $0.0900 mark.