Polygon (POL) Price Prediction: POL/USDT Retreats Below the $0.4248 Threshold
Estimated Reading Time: 3 minutes
Don’t invest unless you’re prepared to lose all the money you invest. This is a high-risk investment and you are unlikely to be protected if something goes wrong. Take 2 minutes to learn more
Polygon (POL) Price Prediction: August 31
Price activity in the Polygon market had broken out of the resistance level at the $0.4248 price mark. The market extended its upside correction through the $0.500 and even the $0.600 price marks. However, downward forces resumed and plunged the market through the previously broken price levels.
POL/USDT Long-term Trend: Bullish (Daily Chart)
Key Price Levels:
Resistance: $0.5000, $0.6000, $0.7000
Support: $0.4000, $0.3000, $0.2000
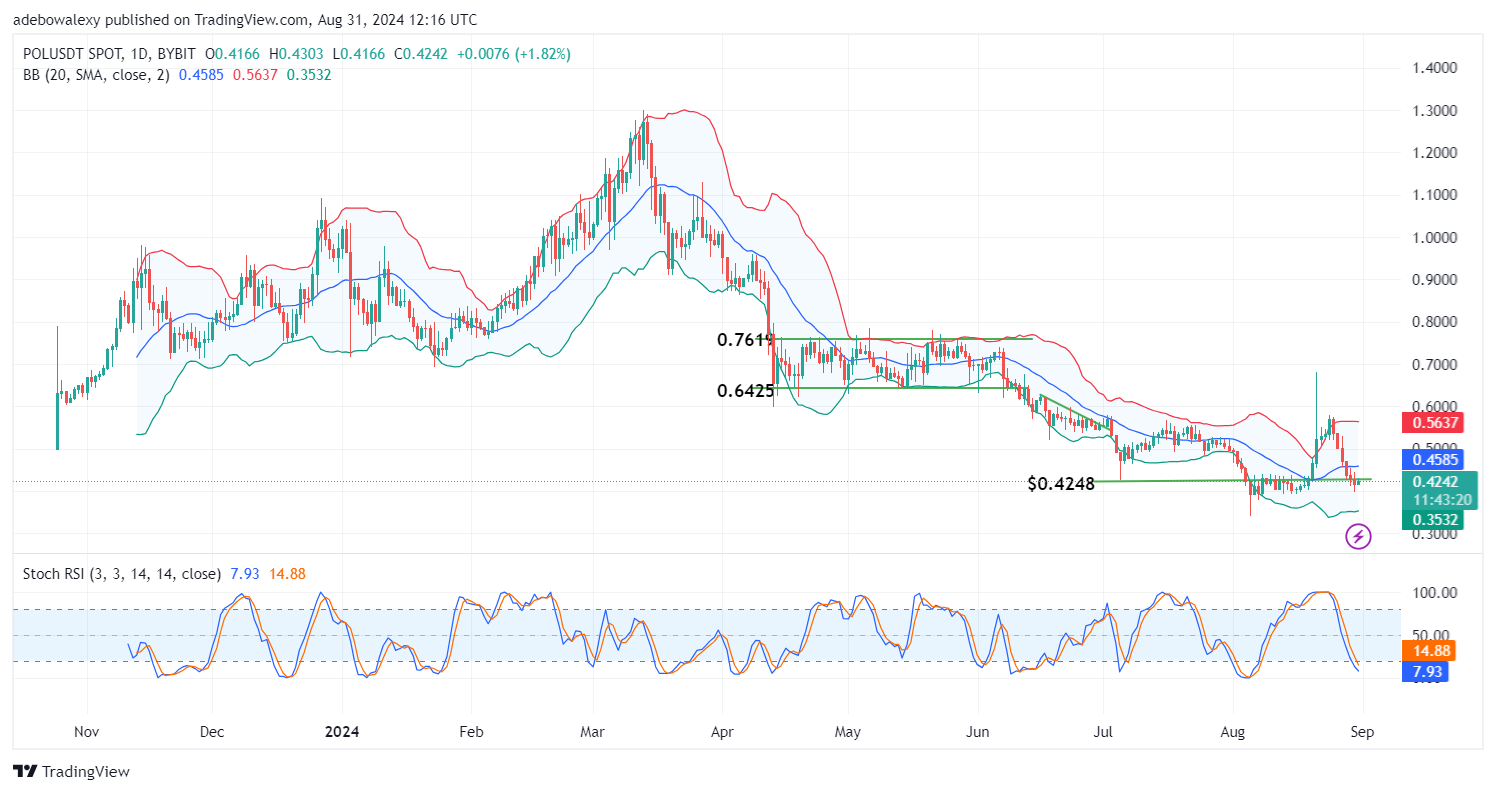
Price action in the POL/USDT market now trails below the $0.4248 price mark. The current position of price activity lies below the middle limit of the Bollinger Bands (BB) indicator. Meanwhile, the corresponding price candle for the ongoing session has appeared green and seems to be testing the resistance at the $0.4248 price level for a breakthrough. The Stochastic Relative Strength Index (Stochastic RSI) lines are generally moving into the oversold region but seem to be displaying a smooth sideways curve.
Polygon (POL) Price Prediction: Are POL/USDT Bears Trying to Regain Control?
The POL/USDT market has seen a significant downward correction following the most recent bullish activity. This resulted in a subsequent steep decline as bulls lacked the resilience to sustain their move.
Nevertheless, the ongoing session suggests that bulls are staging a challenge and trying to break free from trading below the $0.4248 price level. Meanwhile, the Stochastic RSI lines still have an overall downward trajectory but display a smooth, sideways curve. Therefore, it may be too early to make concrete bullish predictions.
Polygon (POL) Price Prediction: POL/USDT Is Facing a Tough Challenge (4-Hour Chart)
In the Polygon 4-hour market chart, it can be seen that price action has reduced volatility. This occurred after the market challenged the resistance at the $0.4248 mark. The ongoing session has appeared as a dash-shaped red price candle. Also, price action remains below the middle limit of the BB indicator. Meanwhile, the Stochastic RSI lines are still lurking in the overbought region.
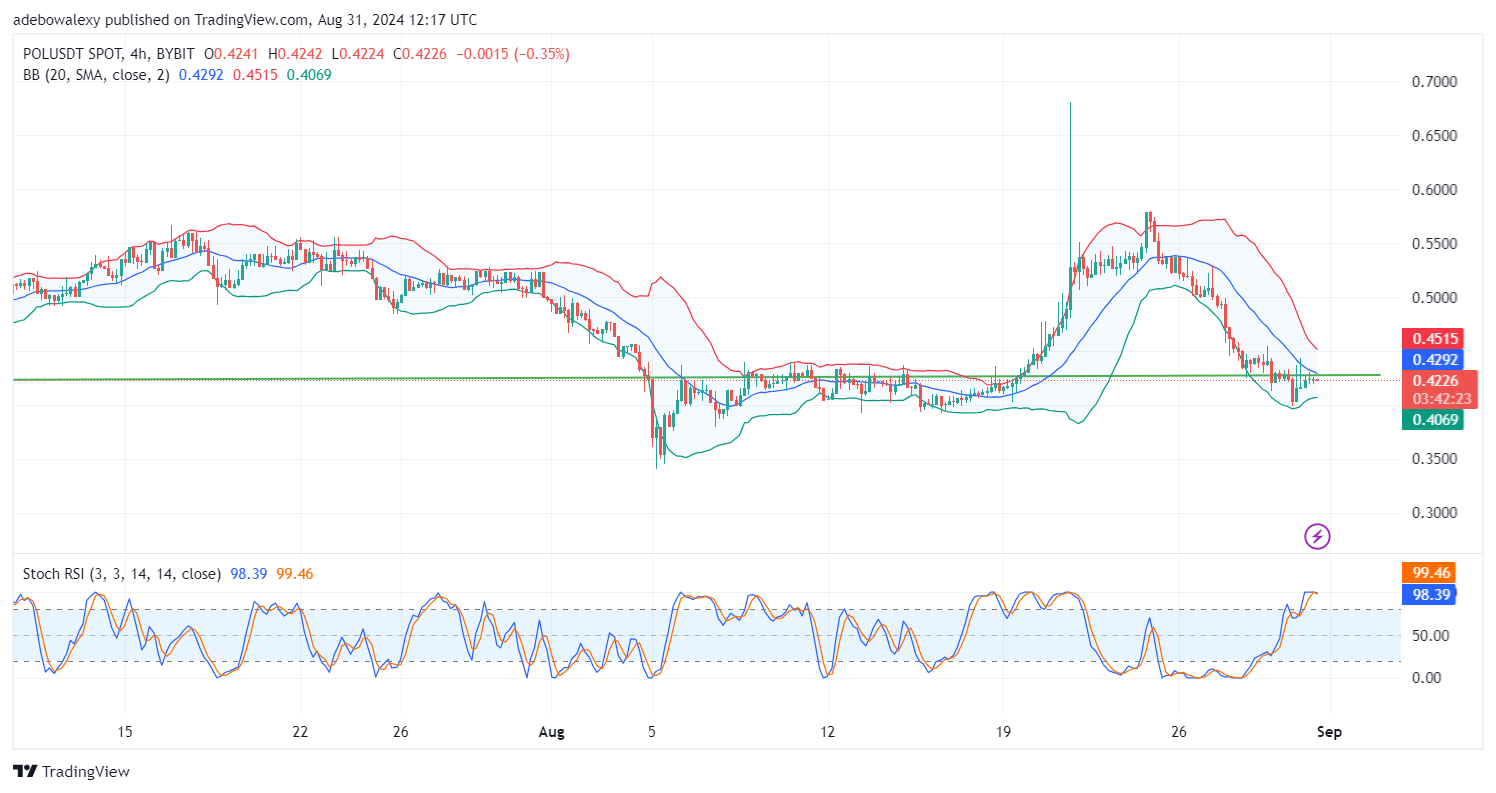
While the Polygon market has seen some upside recovery, it is evident that price movement is facing a challenge in crossing above the $0.4248 price level. Therefore, traders can wait on the sidelines until price movement crosses above the mentioned price level and the middle band of the BB indicator.