Solana (SOL) Price Prediction: SOL/USDT May Push Lower
Estimated Reading Time: 3 minutes
Don’t invest unless you’re prepared to lose all the money you invest. This is a high-risk investment and you are unlikely to be protected if something goes wrong. Take 2 minutes to learn more

Solana (SOL) Price Prediction: August 29
The price movement for the Solana token has been trading within a wide range of $185 and $123 since April. Recently, the market rebounded off resistance indicated by a technical indicator. Since then, bears seem to have gained moderate momentum.
SOL/USDT Long-term Trend: Bullish (Daily Chart)
Key Price Levels:
Resistance: $140, $150, $160
Support: $5.00, $4.50
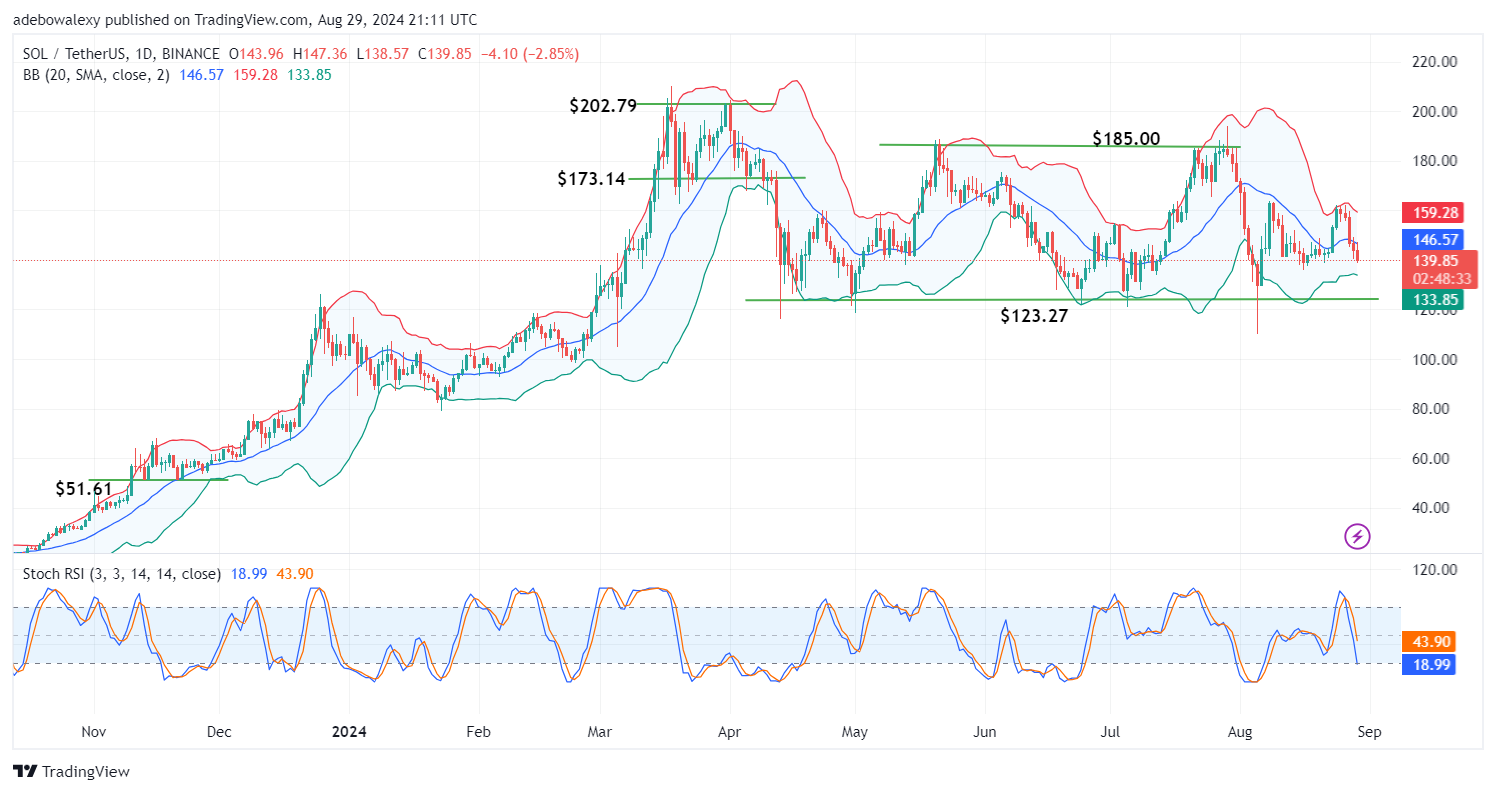
Price action for the Solana token rebounded from the $160 resistance level about four sessions ago. Subsequently, the market moved downwards, breaking through the middle limit of the Bollinger Bands (BB) indicator. At the same time, the Stochastic Relative Strength Index (Stochastic RSI) has quickly fallen into the oversold region, indicating a predominantly bearish trend in this market.
Solana (SOL) Price Prediction: SOL/USDT Bears Are Gaining Momentum Quickly
Once the price action in the Solana market tested the resistance at the uppermost limit of the BB indicator, it fell sharply through the middle band. The token now trades below this part of the indicator. Similarly, the Stochastic RSI has also dipped below the 50 mark.
Technically, this suggests that bears are currently in control and may continue to make progress. The nature of the last price candle also indicates that price action is moderately volatile, which may help downward forces advance further.
Solana (SOL) Price Prediction: SOL/USDT Bears Continue to Dominate the Market (4-Hour Chart)
In the SOL/USDT 4-hour chart, the previous session showed a significant price decline. Since falling below the middle band of the BB indicator, the price action has continued downward. The current session remains bearish, but there appears to be a significant reduction in momentum. Additionally, the Stochastic RSI lines have formed another bearish crossover in the oversold region.
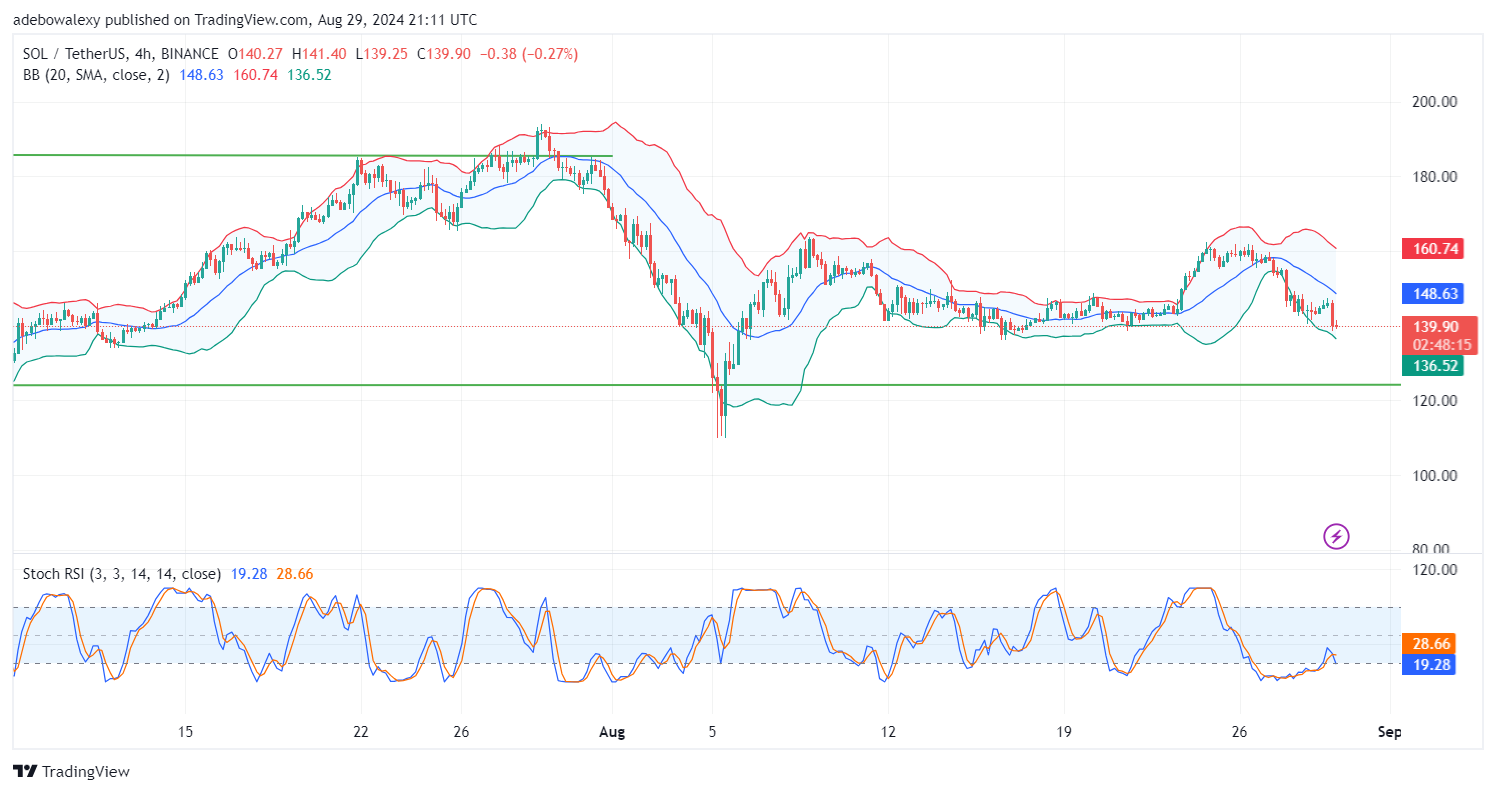
Technically, it appears that the Solana market is set for further price declines. This is indicated by the fact that the price action remains below the middle limit of the BB indicator, and the Stochastic RSI lines suggest that downward pressure is still active. Therefore, it seems likely that the market may hit support at the $135.00 price level.