Uniswap (UNI) Price Prediction: UNI/USDT Steadily Approaches the $6.00 Mark
Estimated Reading Time: 3 minutes
Don’t invest unless you’re prepared to lose all the money you invest. This is a high-risk investment and you are unlikely to be protected if something goes wrong. Take 2 minutes to learn more
Uniswap (UNI) Price Prediction: August 29
The price of the Uniswap token has recently fallen below the $6.00 threshold, now trading at $5.97 per coin. Although the market had rebounded off a key part of a trading indicator, price action in this market still lies below the psychological price level of $6.00.
UNI/USDT Long-term Trend: Bullish (Daily Chart)
Key Price Levels:
Resistance: $6.00, $6.50, $7.00
Support: $5.50, $5.00, $4.50
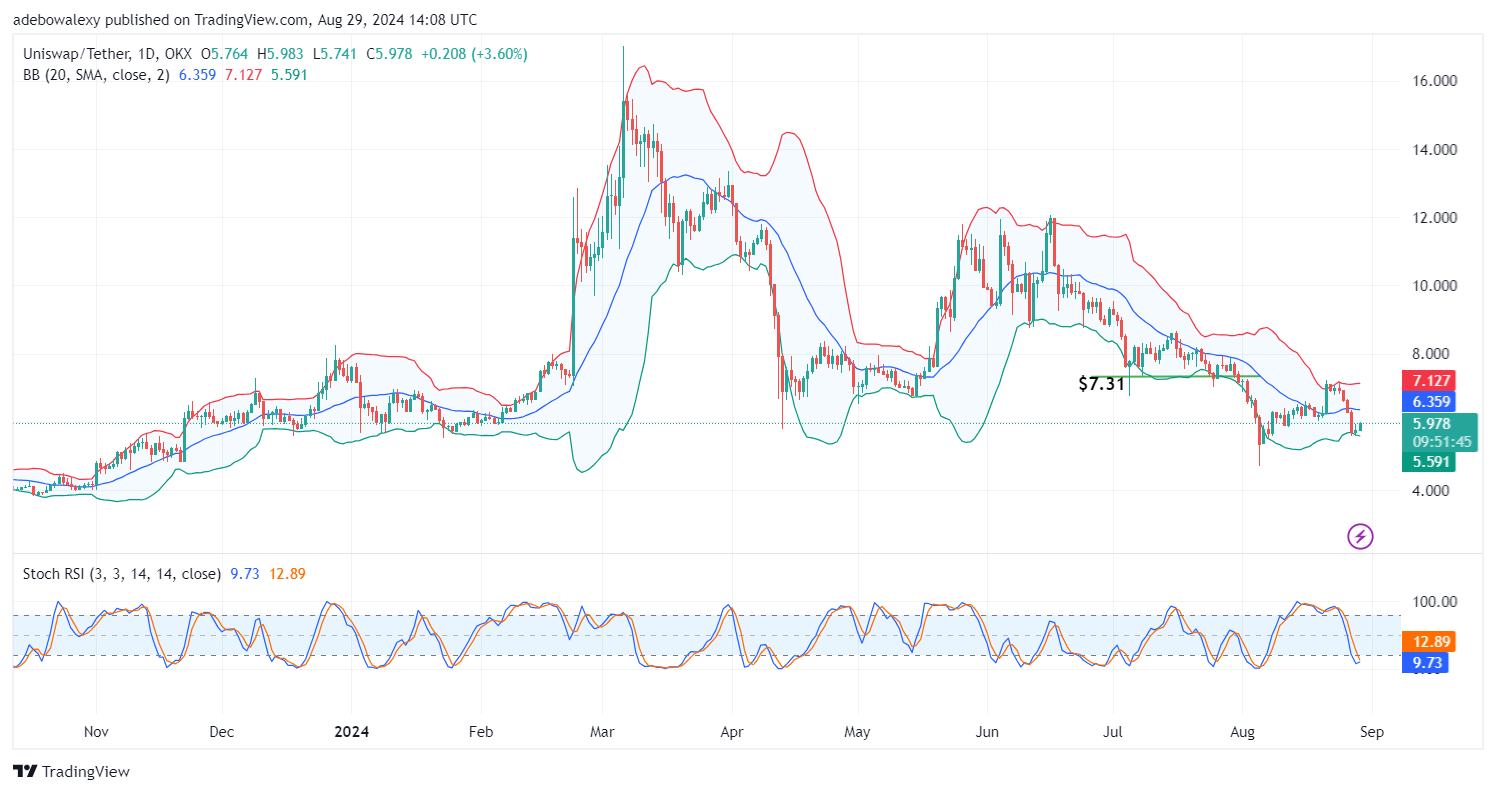
The mentioned rebound occurred in the previous session. Furthermore, the ongoing session has printed a more significant upward move in the Uniswap daily market, considering the size of the corresponding price candle. However, the market still trades below the middle limit of the Bollinger Bands (BB) indicator. In line with the upward retracement, the Stochastic Relative Strength Index (Stochastic RSI) indicator can be seen approaching a bullish crossover in the overbought region.
Uniswap (UNI) Price Prediction: UNI/USDT Bears May Regain Control, But Upside Forces Are Active
At the moment, it appears that upside forces are in control of price movement. However, it should be noted that price action is still vulnerable. This view is supported by the fact that Uniswap still trades below the middle limit of the BB indicator. Nevertheless, the Stochastic RSI indicator lines can be seen approaching a bullish crossover while still in the oversold region.
Signs from applied trading indicators suggest that price actions are still active and may propel the market. Nevertheless, we cannot ignore the fact that price action is still vulnerable. As a result, traders may choose to wait until price action crosses the middle limit of the BB indicator or go long right away.
Uniswap (UNI) Price Prediction: UNI/USDT Bulls Are Extending Their Lead (4-Hour Chart)
The 4-hour Uniswap market shows that price action has moved steadily towards the middle limit of the BB indicator. The last price candle here stands just below the middle limit of the BB indicator. Meanwhile, the Stochastic RSI indicator lines have reached the 100 level of the indicator and have moved sideways at that mark.
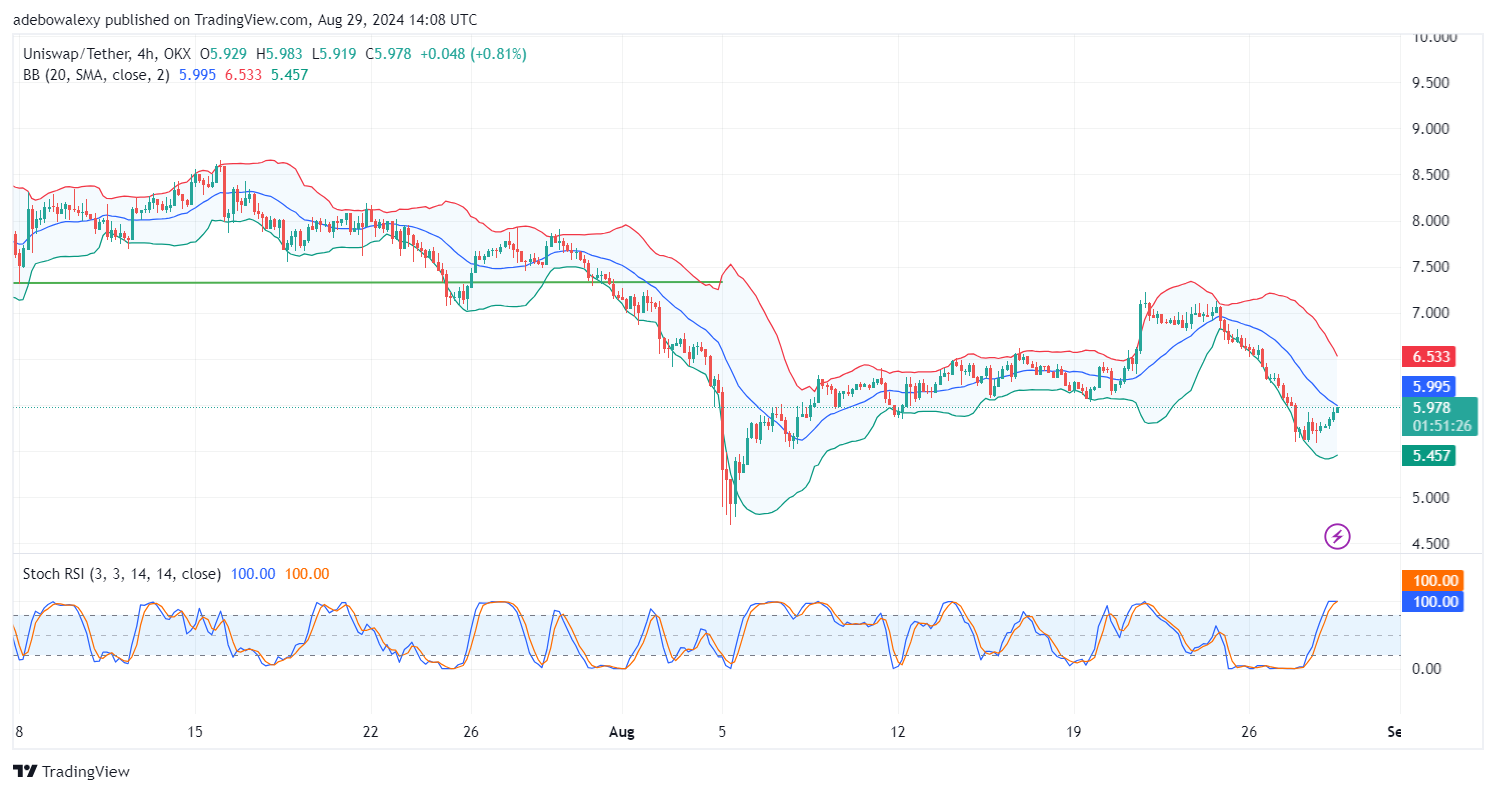
While there has been a steady and moderate upside price movement over the past sessions, the behavior of the Stochastic RSI indicator lines seems a bit exaggerated. This suggests that upside forces will need to gain significant traction to keep the market on an upward path. The appearance of the least.