Bitcoin (BTC) Price Prediction: BTC/USDT Plunges Back Below the $60,000 Threshold
Estimated Reading Time: 3 minutes
Don’t invest unless you’re prepared to lose all the money you invest. This is a high-risk investment and you are unlikely to be protected if something goes wrong. Take 2 minutes to learn more
Bitcoin (BTC) Price Prediction: August 28
The Bitcoin market had earlier surged towards the $64,000 mark but lacked the necessary catalyst to convincingly break that threshold. The market then reversed direction. Although this reversal was moderate at first, it escalated further.
BTC/USDT Long-term Trend: Bearish (Daily Chart)
Key Price Levels:
Resistance: $60,000, $65,000, $70,000
Support: $55,000, $50,000, $45,000
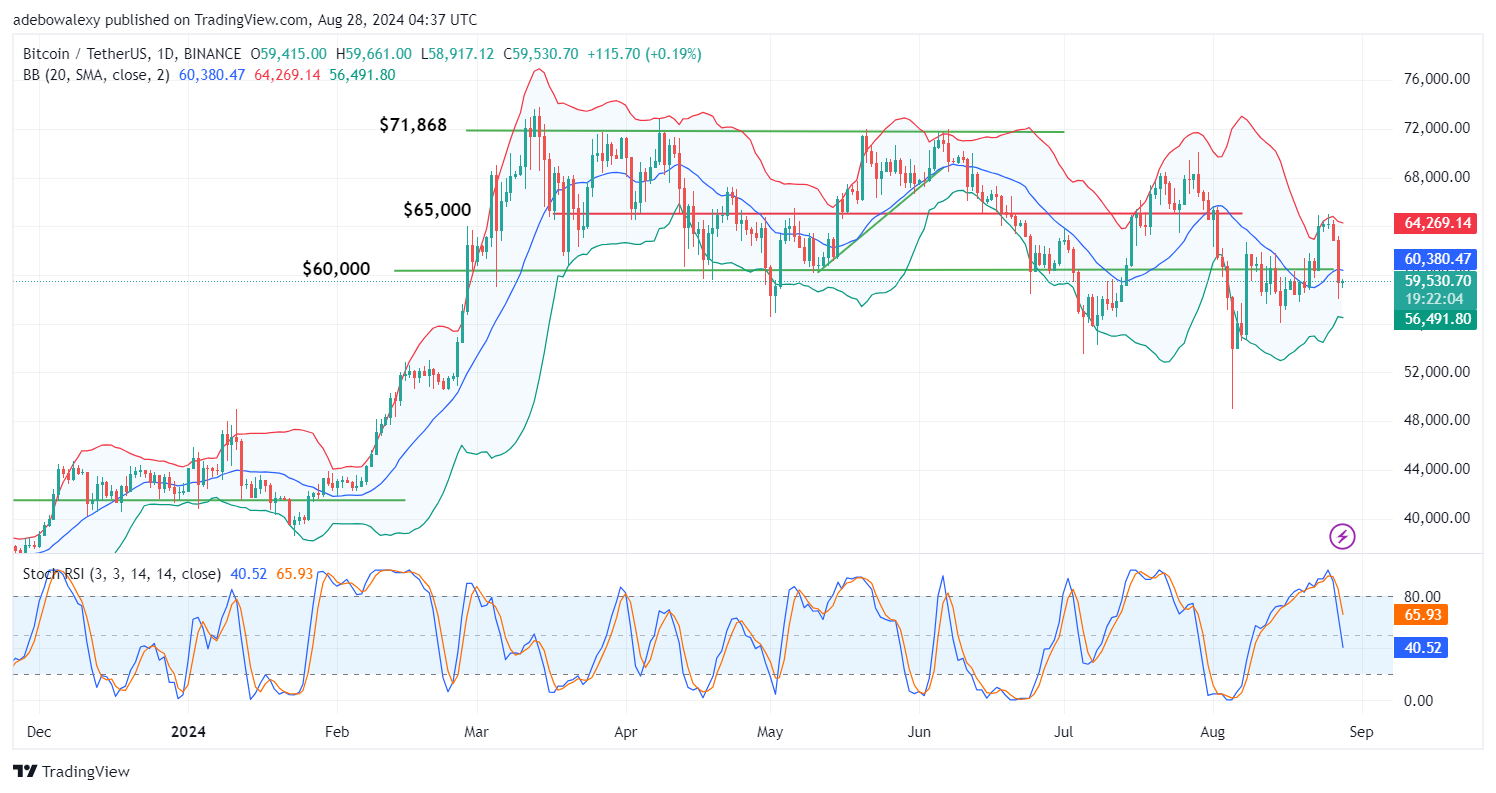
BTC 24-Hour Chart
The price dipped significantly in the previous session. The last price candle on the chart brought the token to trade below the middle limit of the Bollinger Bands. Today’s session has shown only a minor recovery, indicating that downward forces are still dominant. Additionally, the Stochastic Relative Strength Index (RSI) lines are falling steeply, reflecting the strength of bears in the market.
Bitcoin (BTC) Price Prediction: Bears Maintain a Firm Grip on the BTC/USDT Market
The Bitcoin daily market is under significant bearish pressure. This was evident in the previous session, as indicated by the corresponding price candle. The price candle for today’s session has also appeared below the Bollinger Bands indicator, suggesting that price action may still be vulnerable to further declines.
Moreover, the Stochastic RSI lines are falling deeply into the oversold region, indicating strong bearish momentum. Observing the terminals of the Bollinger Bands indicator reveals that the overall trajectory is trending downward.
Bitcoin (BTC) Price Prediction: BTC/USDT Bears Continue to Dominate the Market (4-Hour Chart)
Since the price action experienced a steep decline in the past two sessions, as shown by the 4-hour chart, volatility has decreased significantly. This trend is evident in both the ongoing and the previous sessions. For the ongoing session, the corresponding price candle appears as a dashed shape and is below the lowest band of the indicator. Similarly, the Stochastic RSI curves are on a downward trajectory while deep in the oversold region.
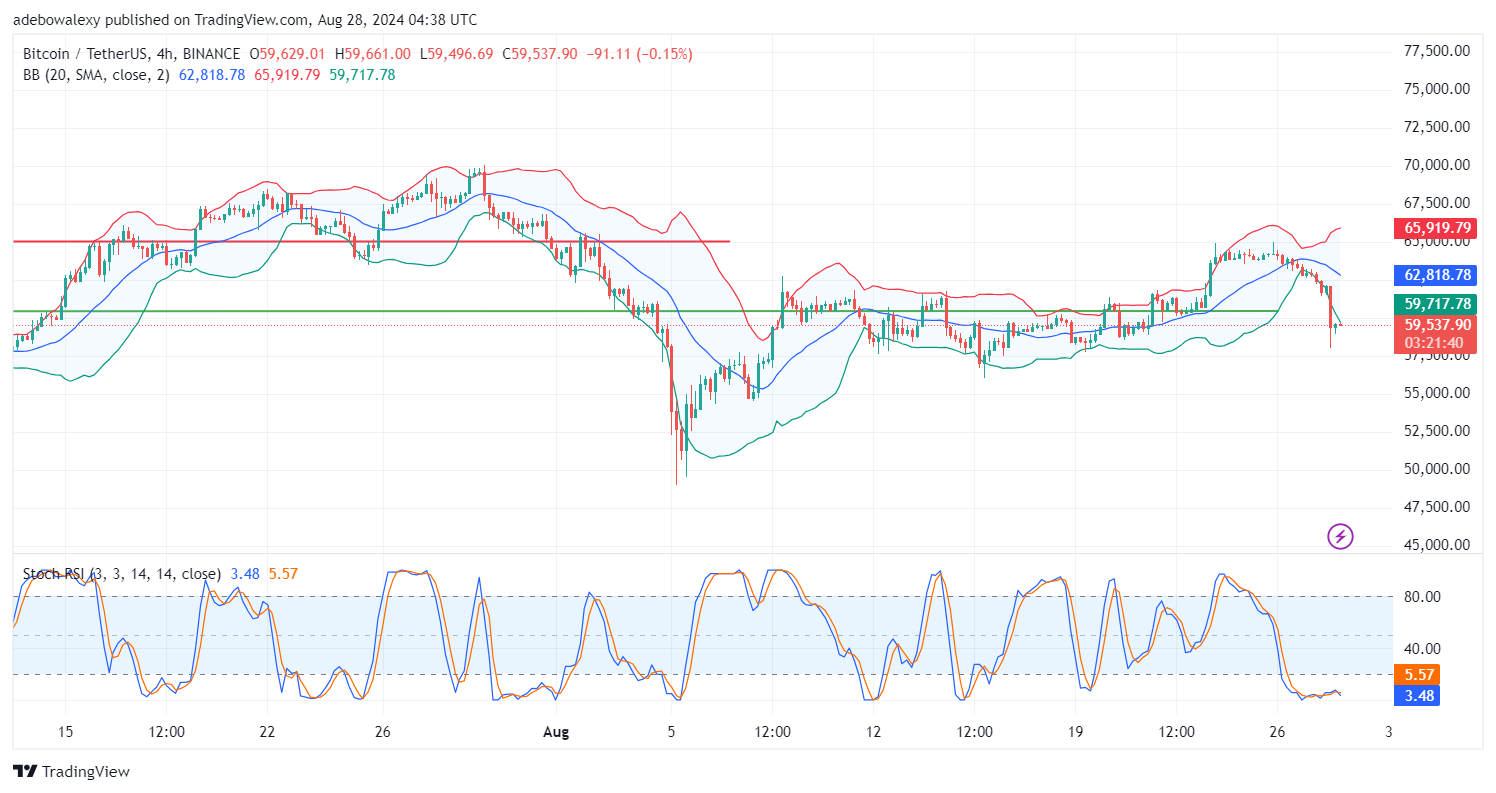
BTC 4-Hour Chart
This suggests that bears remain dominant in the market. As a result, the market appears vulnerable and may decline further. The appearance of the last price candle suggests that price action may continue to hug the lower limit of the Bollinger Bands indicator, potentially bringing the market down to the $57,000 mark.