Litecoin (LTC) Price Prediction: LTC/USDT Retreated Below Key Levels as Bitcoin Dips
Estimated Reading Time: 3 minutes
Don’t invest unless you’re prepared to lose all the money you invest. This is a high-risk investment and you are unlikely to be protected if something goes wrong. Take 2 minutes to learn more

Litecoin (LTC) Price Prediction: August 27
Price activity in the Litecoin market has retraced downward with moderate vigor. This is happening simultaneously with Bitcoin dipping below the $64,000 price level. However, the ongoing session has presented some bullish deflection, yet the market does not seem to be significantly influenced at this point.
LTC/USDT Long-term Trend: Bearish (Daily Chart)
Key Price Levels:
Resistance: $65.00, $70.00, $75.00
Support: $60.00, $55.00, $50.00
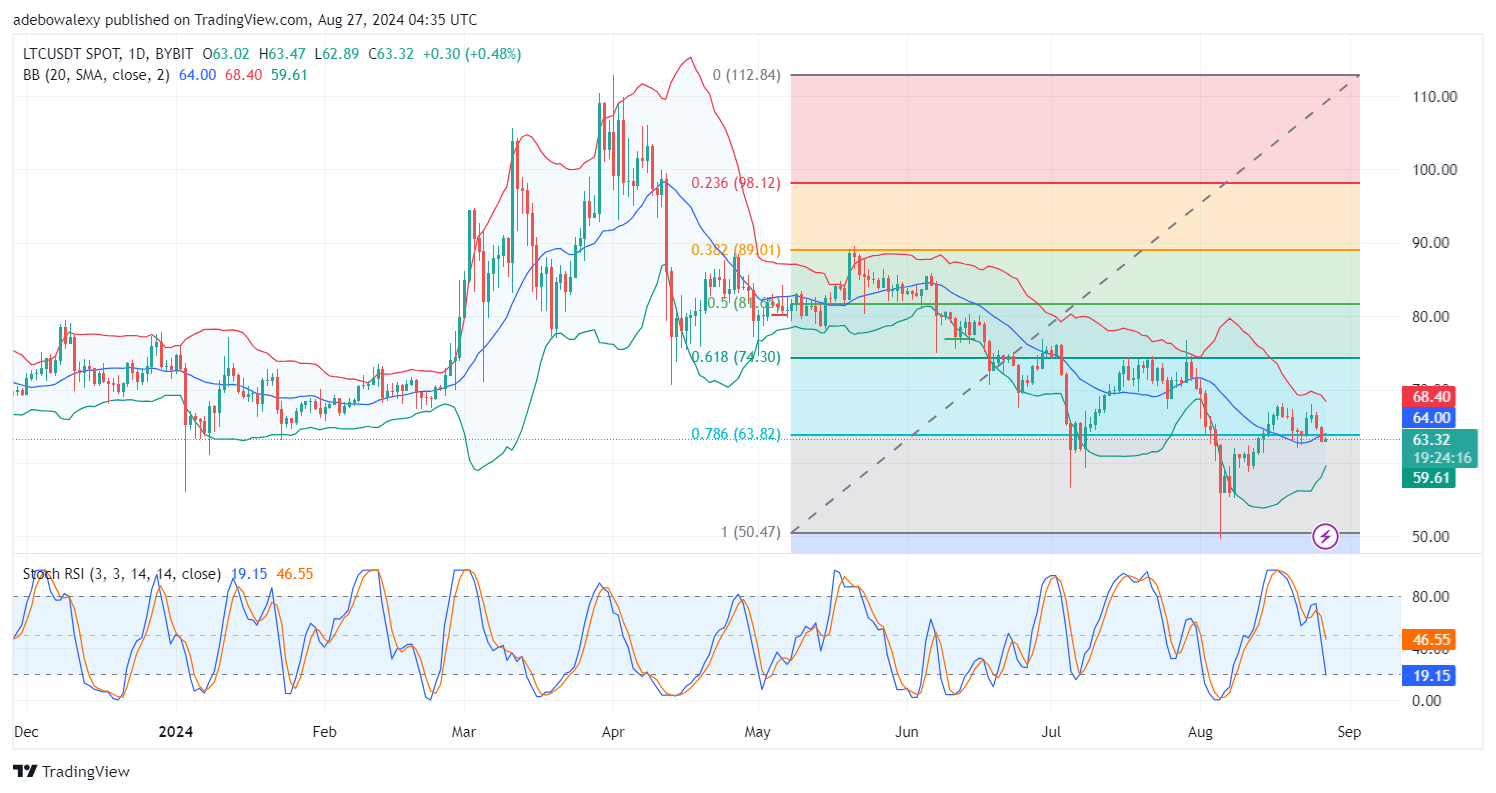
As stated earlier, the ongoing session in the Litecoin market has shown an upward correction, as indicated by the appearance of the last price candle. However, it should be mentioned that the session is now occurring below the middle limit of the Bollinger Bands (BB) indicator. Meanwhile, the BB indicator can be seen contracting. Additionally, the Stochastic Relative Strength Index (Stochastic RSI) leading line has fallen deep into the oversold region.
Litecoin (LTC) Price Prediction: LTC/USDT Presents a Market with Mixed Indications
Litecoin has seen some minimal recovery from the price decline of the past two sessions. However, the fact that the recovery is occurring below the middle line of the BB indicator suggests a subdued tone on the move.
Despite this, the BB indicator’s upper and lower limits can be seen converging, while the indicator itself seems slightly tilted upwards. Technically, this hints that upside forces may be lying in wait to slingshot upwards. However, the volatility of the Stochastic RSI suggests that traders may want to exercise some caution here.
Litecoin (LTC) Price Prediction: LTC/USDT Sees an Upward Rebound (4-Hour Chart)
The LTC/USDT 4-hour market has revealed that price action has rebounded off the lowest limit of the BB indicator. However, this happened in the previous session, while the ongoing session presented a minimal downward retracement. Nevertheless, the Stochastic RSI lines maintain their upward projection. This seems to be because the observed downward correction is quite minimal.
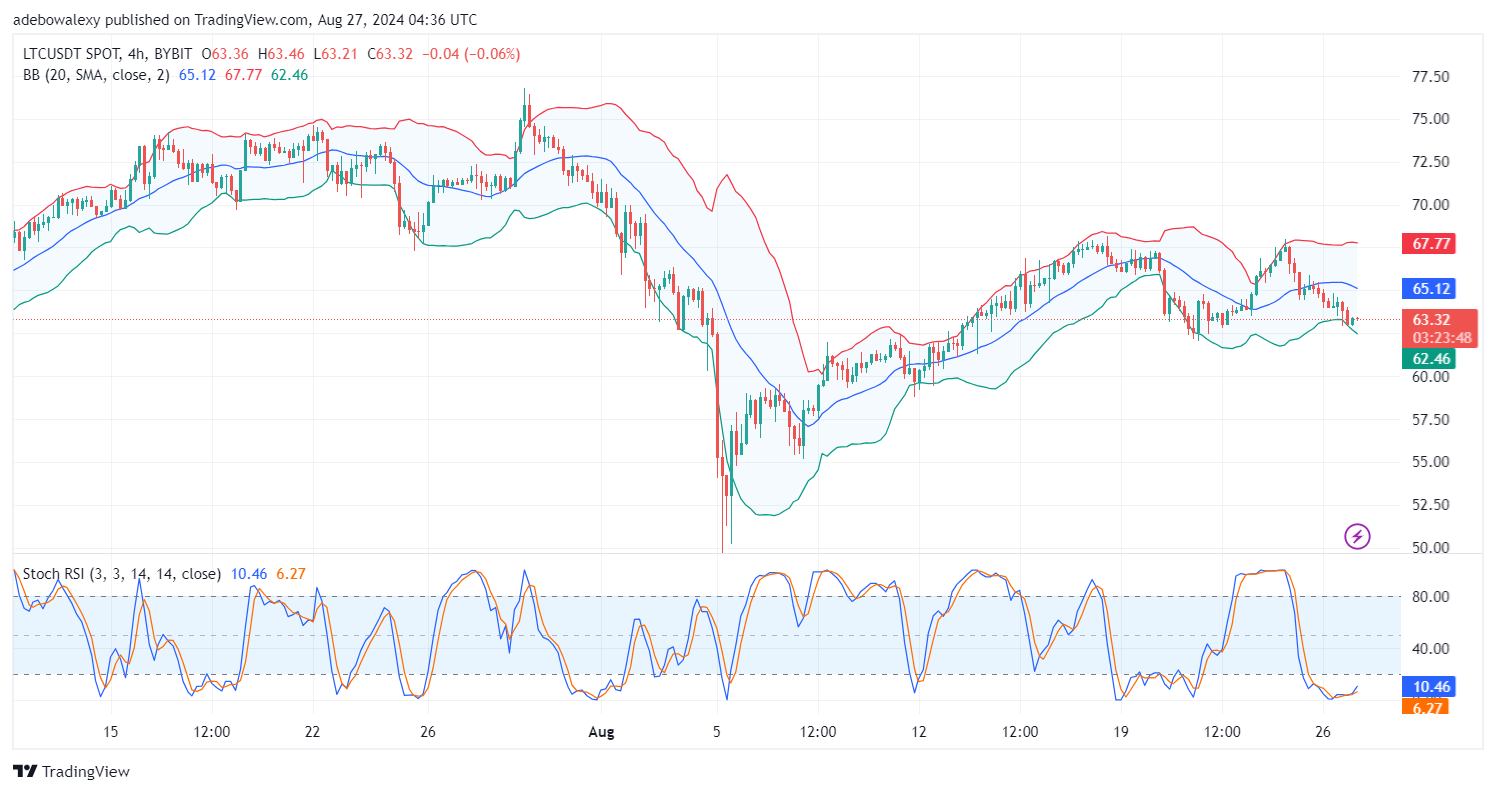
Even so, the fact that the market is below the middle band of the Bollinger Bands suggests that the minimal downward retracement seems potent. This could result in further downward price action. Consequently, traders may want to brace for impact at the $60 price level, all things being equal.