Binance Coin Regains Bullish Momentum but Risks Decline to $194
Estimated Reading Time: 2 minutes
Don’t invest unless you’re prepared to lose all the money you invest. This is a high-risk investment and you are unlikely to be protected if something goes wrong. Take 2 minutes to learn more
Binance Coin (BNB) Long-Term Analysis: Bearish
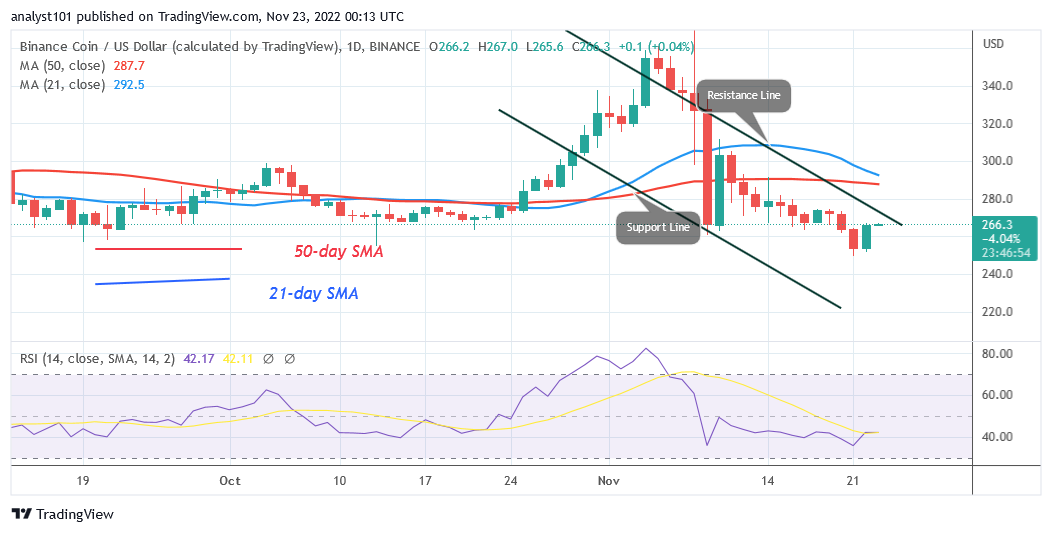
Binance Coin (BNB) price is in a negative trend after breaking through the recent support but risks decline to $194. The last range between levels $260 and $300 was broken by sellers. The coin has recently picked up positive momentum again, reaching a high of $272. BNB resumed its ascent and reached a high of $272.However, the major tendency is a downturn, thus the upward trend is only transitory. The price of the cryptocurrency is now range-bound. If the bears are successful in breaching the lower price of $260, the altcoin will drop even more, to its low of $200 or $194. BNB will start trading in a band between $260 and $300 or break above the moving average lines, however, if buyers retain the existing support.
Technical indicators:
Major Resistance Levels – $440, $460, $480
Major Support Levels – $240, $220, $200
Binance Coin (BNB) Indicator Analysis
The Relative Strength Index for period 14 is at level 44. The most recent upward correction has caused the RSI to rise. The price of the cryptocurrency is probably going to drop since the price bars are below the moving average lines. Binance Coin’s daily Stochastic is above level 25. The coin’s bullish momentum has returned.
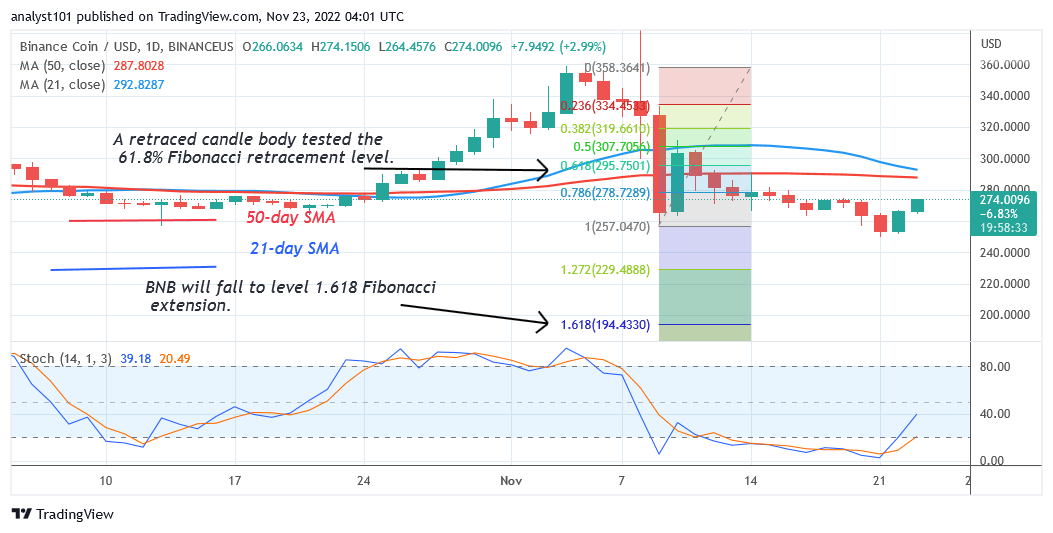
What Is the Next Direction for Binance Coin (BNB)?
After breaking below the present support, Binance Coin is now in a downturn but risks a decline to $194. At the most recent high, the present upward correction will be rejected. On November 9, when the price of BNB was in a downward trend, it corrected upward and a candle body tested the 61.8% Fibonacci retracement line. BNB will decrease in price following the adjustment to level 1.618 of the Fibonacci extension, or $194.43.
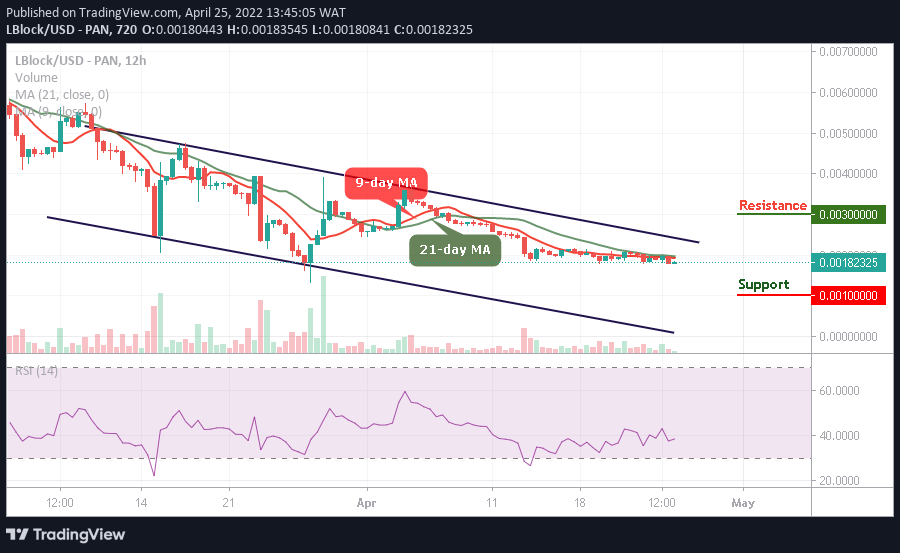
You can purchase crypto coins here. Buy LBLOCK
Note: Cryptosignals.org is not a financial advisor. Do your research before investing your funds in any financial asset or presented product or event. We are not responsible for your investing results