ZKsync (ZK/USDT) Halts Bearish Move, Eyes Recovery Above $0.0701
Estimated Reading Time: 3 minutes
Don’t invest unless you’re prepared to lose all the money you invest. This is a high-risk investment and you are unlikely to be protected if something goes wrong. Take 2 minutes to learn more

The market for ZKsync against the Tether is showing early signs of bullish momentum, despite a minor 1.29% decline after opening at $0.0695. However, after months of downward pressure, the pair appears to be gaining traction, fueled by increasing participation despite signals from the Stochastic RSI.
To this end, the pair hovers around a critical resistance level that could determine whether a short-term breakout or further accumulation lies ahead.
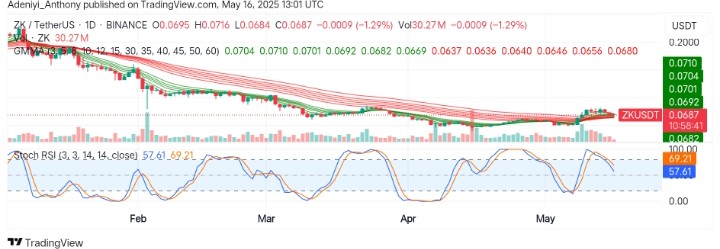
Currently, ZKsync trades at $0.0687, recording 30.27 million trades for the day.
Technical Indicators
Major Resistance Levels: $0.0701, $0.0750, and $0.0800
Major Support Levels: $0.0650, $0.0600, and $0.0500
ZKsync Technical Analysis
Currently, ZKsync against the Tether is attempting to push above the short-term Guppy Multiple Moving Averages (GMMAs) bands, indicating a bullish sign and a potential momentum shift. However, recent volume spikes show the bulls are getting ready for a potential trend change.
On the other hand, the Stochastic RSI is currently showing a slight downward cross, with the blue line (57.61) dipping below the orange line (69.21). However, this may suggest a short-term cooldown, but both lines are still within bullish territory, indicating ongoing buyer interest.
To this end, if the blue line bounces near the 50-mark level with a sustained volume, an upside move above $0.0701 in the near term could be recorded.
ZK/USDT Analysis: Where from Here?
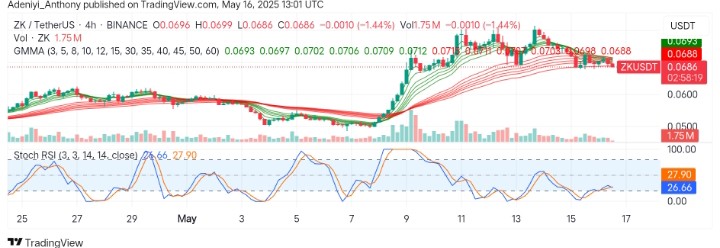
The analysis of ZK/USDT on the 4H chart, shows the pair is in a consolidation phase after a strong rally from earlier sessions at the beginning of the month of May. However, the pair’s price still ranges above the long-period EMAs, signaling possible trend continuation if bullish support holds.
As it stands, the recent dip in volume indicates a cooling-off period. However, the Stochastic RSI is deep in the oversold zone (26.66 & 27.90), suggesting potential for an upward bounce.
To this end, if the price remains compressed near $0.0686, a critical decision level for bulls and bears is likely created. However, if buyers step in near current levels, the momentum could push back toward $0.0712.
You can purchase crypto coins here. Buy LBlock