Zksync (ZK/USDT) Eyes Potential Reversal After a Prolonged Downtrend
Estimated Reading Time: 2 minutes
Don’t invest unless you’re prepared to lose all the money you invest. This is a high-risk investment and you are unlikely to be protected if something goes wrong. Take 2 minutes to learn more
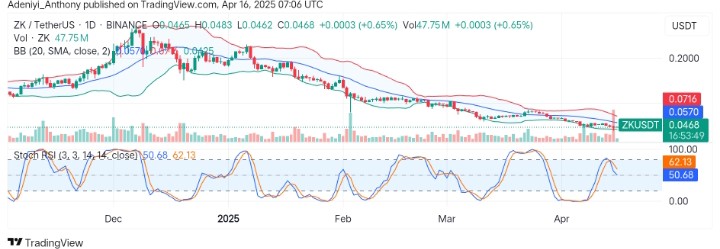
The market for ZKsync against the Tether has been in a downtrend for an extended period of time with a consistent formation of lower highs and lows. The pair since the latter part of 2024 has been falling in value and operating below the dynamic 20-period simple moving average of the Bollinger bands despite efforts of the bullish traders to break above it.
However, recent price action suggests a potential shift in momentum is on the horizon as the price is attempting a move to the north with a moderate uptick in volume.
Currently, Zksync trades at $0.0468, recording over 47 million traded volumes for the day.
Technical Indicators
Major Resistance Levels: $0.0570, $0.0716, and $0.0900
Major Support Levels: $0.0425, $0.0380, and $0.0300
Zkysnc Technical Analysis
The analysis of Zksync against the Tether on the daily timeframe shows that the pair is approaching Bollinger’s dynamic level, hinting at a trend reversal. However, the volume spike suggests a possible accumulation.
On the other hand, the Stochastic RSI suggests no clear overbought signal but a slowing momentum as the lines point to the south.
To this end, a movement above $0.0490 and $0.0500 would lead to a target of $0.0716 in the near term. Conversely, a fade in the price level might suggest a move towards $0.0380.
ZK/USDT Analysis: What’s Happening Here?
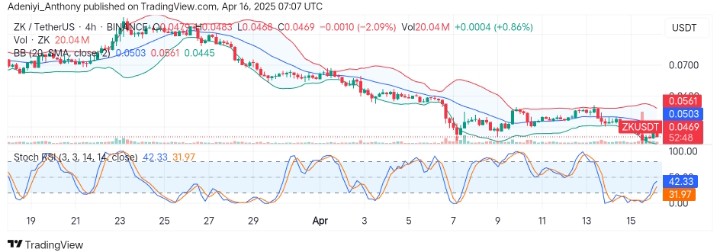
On the 4H chart, ZK/USDT is consolidating around $0.0460 to $0.0470 after a minor sell-off, after testing the lower Bollinger band. However, the Stochastic oscillator at the bottom of the chart is beginning to curl to the north, indicating a potential short-term bounce might play out.
As it stands, the Bollinger Bands are tightening, and a break above $0.0506 would confirm a momentum shift; otherwise, the price may continue to hover around the same level.
You can purchase crypto coins here. Buy LBlock