Zksync (ZK/USDT) Eyes Rebound from Oversold Zone
Estimated Reading Time: 3 minutes
Don’t invest unless you’re prepared to lose all the money you invest. This is a high-risk investment and you are unlikely to be protected if something goes wrong. Take 2 minutes to learn more

The market for ZKsync against the Tether, once riding a bullish wave, has faced downward pressure over the past few months, slipping past a series of supports and establishing new ones. For some time the pair has been forming new lows after reaching a height of about $0.1400. However, despite this substantial price decline, the pair is showing early signs of accumulation for a potential upside movement.
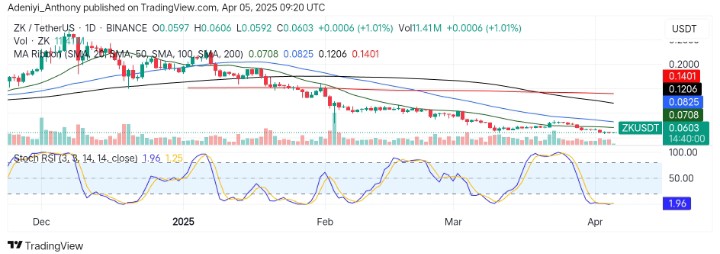
As it stands, the chart below shows buyers are cautiously stepping into the market as the volume sees a slight increase. To this end, can ZK/USDT bullish traders set the stage for a bullish recovery?
Currently, ZKsync trades at $0.0603, with a daily gain above 1% and 11.41 traded volumes already.
Technical Indicators
Major Resistance Levels: $0.0708, $0.0825, and $0.1206
Major Support Levels: $0.0600, $0.0592, and $0.0500
ZkSync Technical Analysis
The analysis for Zksync against the Tether on a daily timeframe shows the pair has been on a clear downtrend since late last year, slicing through support levels along the line. However, the current price action suggests a weakened selling pressure as the price sees a significant gain despite signals from the Moving Averages Ribbons.
Additionally, the Stochastic RSI signals the pair is oversold as the lines read extremely deep values, suggesting the coin is really undervalued and may see a short-term bounce soon.
To this end, the volume is relatively low. However, a spike in volume with heightened bullish participation above $0.0708 would confirm a recovery; otherwise, the pair might see a continued downtrend.
ZK/USDT Analysis: Can the Bulls Sustain Momentum?
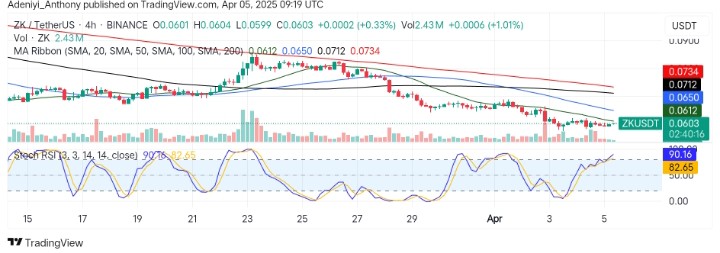
On the 4H chart, ZK/USDT appears to be gearing up for more gains after a recent bounce from the $0.0599 level with an increasing trading volume, which suggests the bulls are testing resistance zones for a potential breakout. However, the appearance of the price below the key moving averages indicates the bears’ reign is yet to be over, as seen in the southeast directional movement.
The Stochastic RSI, on the other hand, suggests a strong current momentum as the lines show signs of advancement towards the 100-mark level with an increasing volume.
To this end, a clean break above the $0.0620 with rising volume would suggest the bulls are targeting the $0.0712 level; otherwise, the overbought condition signaled by the oscillator may cause rejection near resistance.
You can purchase crypto coins here. Buy LBlock