Zksync (ZK/USDT) Consolidates with Potential Breakout in View
Estimated Reading Time: 2 minutes
Don’t invest unless you’re prepared to lose all the money you invest. This is a high-risk investment and you are unlikely to be protected if something goes wrong. Take 2 minutes to learn more

The market for ZKsync against the Tether has been in a prolonged consolidation phase, moving within a tight range after a big move to the south in earlier trades.
Recently, despite the prevailing bearish sentiment, the ongoing action suggests a potential shift towards bullish momentum, as the price of the pair goes up by 5.44% from the initial session.
To this end, the increase in volume hints at a growing interest, which may lead to a breakout in the coming session.
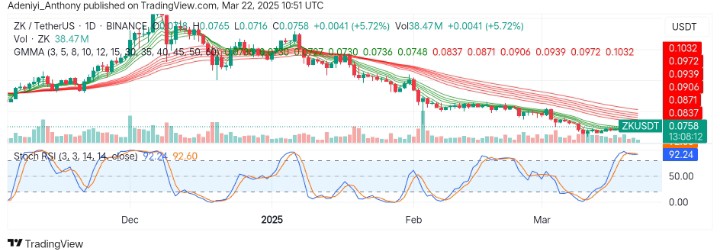
Currently, ZKsync trades at $0.0758, with 38.47 million traded volumes for the day already.
Technical Indicators
Major Support Levels: $0.0780, $0.0800, and $0.0850
Major Support Levels: $0.0740, $0.0725, and $0.0710
ZKsync Technical Analysis
On the daily timeframe, ZKsync is showing signs of an impending breakout, with the price reclaiming a high spot. However, the short-period EMAs of the Guppy Multiple Moving Averages (GMMAs) suggest a bullish breakout attempt with the long-period EMAs staying ahead. This is an indication that the bearish period persists in the market.
However, the momentum indicator beneath the chart signals an overbought condition as the blue line hits above the 90-mark level. This is an indication of a pullback, and except momentum remains strong, ZK/USDT may not maintain the upside moments.
ZK/USDT Analysis: What About Now?
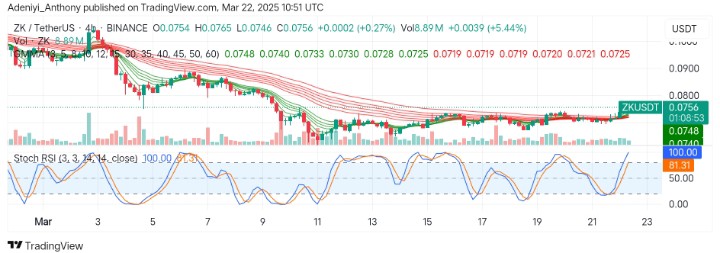
On the 4h chart, ZK/USDT is showing early signs of a breakout as the long-period and short-period EMAs converge with an increasing trading volume of 8.89 million.
However, the Stochastic RSI stressed the importance of caution, as the pair using this time appears overbought. This may suggest an impending pullback before a decisive $0.0860 breakout in the near term.
To this end, more bullish participations are needed as the pair seeks more northbound gains. However, a break below $0.0740 would signal a continued downtrend.
You can purchase crypto coins here. Buy LBlock