SushiSwap (SUSHI/USD) Surges Above $1.00: Can the Bullish Recovery Be Sustained?
Estimated Reading Time: 3 minutes
Don’t invest unless you’re prepared to lose all the money you invest. This is a high-risk investment and you are unlikely to be protected if something goes wrong. Take 2 minutes to learn more

SushiSwap has experienced a significant downturn over the past month, continuing a broader decline that began last year. After peaking near the $3.00 level, the market retraced sharply, wiping out most of the gains from the previous bullish cycle. That previous rally had its foundation around the $0.70 support level, which helped propel the price to its recent high.
Currently, the $0.50 level has emerged as a critical support zone, where bullish traders recently regrouped following a relentless bearish trend. With SUSHI/USD now climbing above the $1.00 mark, traders are watching closely to see if the ongoing bullish recovery can be sustained—or if another correction lies ahead.
SushiSwap (SUSHI/USD) Market Data
- SUSHI/USD Price Now: $0.98
- SUSHI/USD Market Cap: $266 million
- SUSHI/USD Circulating Supply: 275 million SUSHI
- SUSHI/USD Total Supply: 284 million SUSHI
- SUSHI/USD CoinMarketCap Ranking: #182
Key Levels
- Resistance: $1.50, $2.00, and $2.50
- Support: $0.90, $0.85, and $0.80
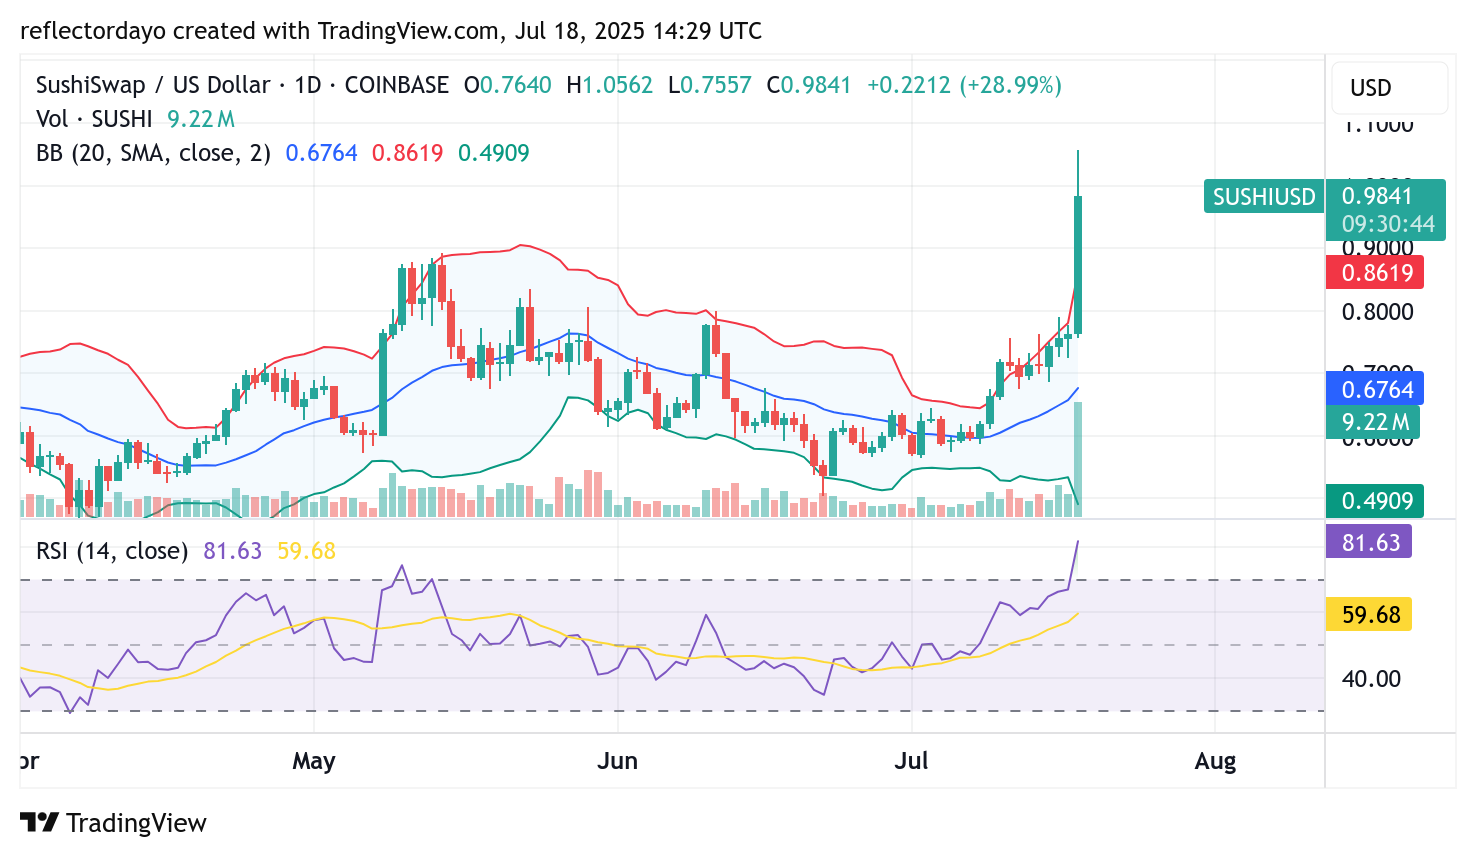
SushiSwap (SUSHI/USD) Daily Chart Outlook: Signs of Recovery Amid High Volatility
Following the onset of the bearish trend near the $3.00 peak, SushiSwap has endured persistent downward momentum, characterized by heightened volatility. Bulls were overwhelmed at key price levels, including the critical $1.00 support, which failed to hold. A meaningful bullish response only began to form around the $0.70 level—coincidentally, the launchpad of the previous rally that had peaked near $3.00. Despite this, bearish pressure remained strong until buyers were finally able to regroup at the $0.50 mark.
In today’s daily trading session, the market is witnessing a sharp rally driven by strong buying activity. Bullish sentiment appears to be building, as reflected by a significant surge in trading volume, evidenced by a prominent volume histogram.
However, such strong bullish momentum can often be followed by exhaustion. Traders are advised to exercise caution and watch for signs of market stabilization before making new entry decisions. The Bollinger Bands are currently wide apart, signaling elevated volatility—a condition that could lead to abrupt price swings in either direction.
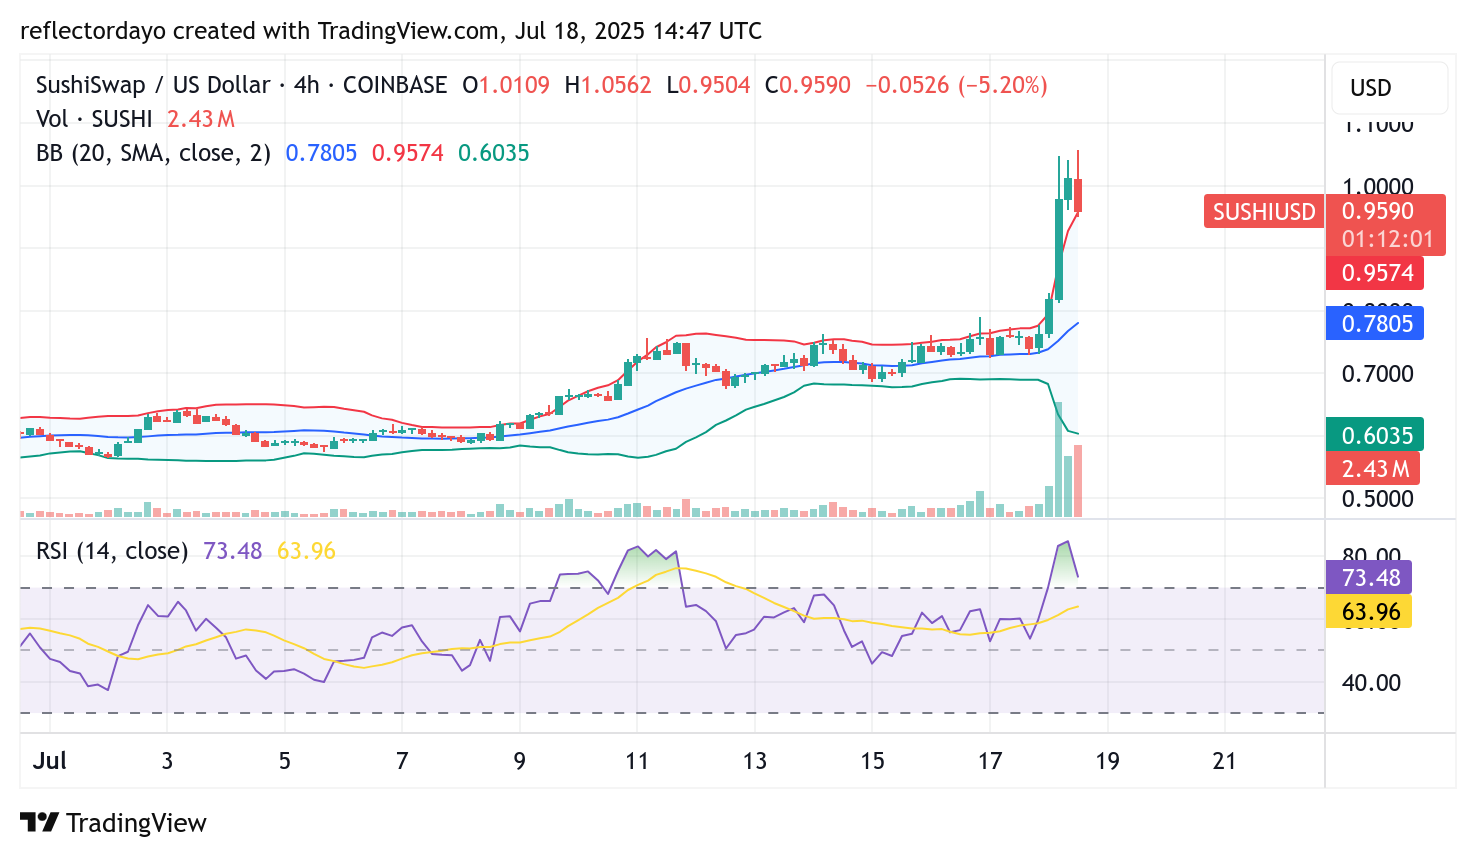
SUSHI/USD 4-Hour Chart Analysis: Signs of a Higher Support Formation Amid Ongoing Correction
The recent strong bullish momentum in the SUSHI/USD market suggests a shift toward establishing higher support levels, reinforcing the progression of the current uptrend. On the 4-hour chart, the $0.90 zone is beginning to emerge as a potential higher support level—especially if the ongoing price correction from the overbought region persists.
Currently, there appears to be a tug-of-war between demand and supply around the $0.95 price level, indicating this area could serve as a short-term point of equilibrium. While $0.95 may act as a potential bounce zone, technical indicators still show that the market remains in overbought territory. This implies that further corrective moves are likely before a more stable support base is formed.

