Ethereum (ETH/USDT) Targets a Critical Resistance Level: What’s Next?
Estimated Reading Time: 3 minutes
Don’t invest unless you’re prepared to lose all the money you invest. This is a high-risk investment and you are unlikely to be protected if something goes wrong. Take 2 minutes to learn more
The market for Ethereum within the last 24 hours has risen by 2.39%. This development shows the token has gone up beyond the broader crypto market’s 0.5% bullish stance. As it stands, regulatory tailwinds such as the U.S. Genius Act passage and SEC case rejection with strong investors’ activities can be attributed to this price movement, as technical indicators such as the Stochastic RSI signal a rebound potentially from the oversold region on the shorter timeframe.
Currently, Ethereum against Tether appears to be targeting the $3,600 psychological level, engulfing the previous candle and trading at $3,546.33 while moving up 3.52% from its opening price.
Technical Indicators
Major Resistance Levels: $3,677, $3,799, and $3,900
Major Support Levels: $3,500, $3,400, and $3,100
Technical Analysis
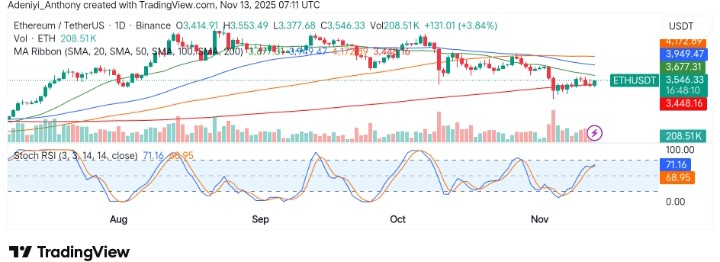
Technically, Ethereum against Tether is finding difficulty breaking above the $3,677 resistance, with the 20-day moving average acting as a barrier. On the daily chart, the pair appears to be experiencing a mix of bullish and bearish indicators.
The stochastic RSI is showing an overbought condition at 71.16, suggesting that a pullback or consolidation in advance than a current upside attempt. The next support to watch is around $3,448, with a potential move toward this level if the resistance continues to hold.
Ethereum Technical Update
A recent update has shown that Ethereum on a short-term chart appears to have been in a corrective pattern between $3,174 and $3,500. This week for the token has not been spectacular, but it looks like the confirmation needed for an upside move is on its way as the price moves to test the upper boundary line of the trend channel. For now, nothing major has happened until the $3,600 line is broken.
ETH/USDT Analysis: Will Momentum Hold?
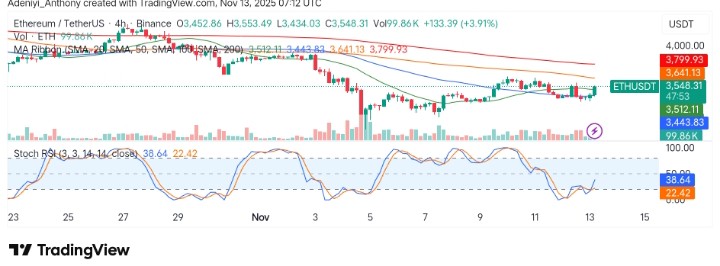
On the 4-hour chart, ETH/USDT appears to be attempting a recovery after a slight pullback, with strong support at $3,543. However, it looks like the recent rally has pushed ETH above the $3,548 resistance zone but faced resistance near $3,799.93.
As it stands, the stochastic RSI is at 22.42, indicating oversold conditions and the potential for a short-term bounce. As the price stabilizes, it could aim for a retest of higher resistance levels around $3,799 or consolidate between $3,543 and $3,677.
You can purchase crypto coins here. Buy Crypto