Wall Street Memes (WSM) Price Firms Up, Raising Hikes Inputting
Estimated Reading Time: 3 minutes
Don’t invest unless you’re prepared to lose all the money you invest. This is a high-risk investment and you are unlikely to be protected if something goes wrong. Take 2 minutes to learn more
Wall Street Memes Price Prediction – September 26
Wall Street Memes (WSM) price action indicates buyers consolidating strength, with momentum gradually aligning toward sustaining accumulation above the $0.0005 level, reinforcing prospects for an extended upward trajectory.
The ongoing firming of Wall Street Memes (WSM) above the $0.0005 mark underscores a consolidative buildup that strengthens bullish conviction. Caution is strongly advised against executing shorting orders, as market structure and momentum dynamics suggest a heightened risk of squeezes that could accelerate upside continuations, leaving bearish entries vulnerable to rapid invalidation.
WSM/USD Market
Key Levels
Resistance levels: $0.0006, $0.0007, $0.0008
Support levels: $0.0004, $0.0003, $0.0002
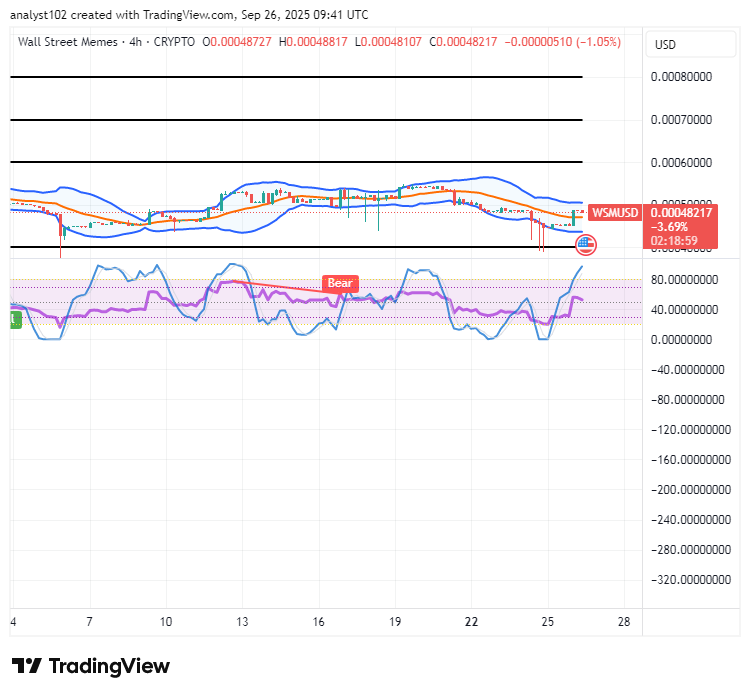
WSM/USD – 4-hour Chart
The WSM/USD medium-term chart indicates the crypto-economic price is firming, with incremental hikes inputting into its trading structure, reflecting strengthening buyer dominance within the evolving market framework.
The Stochastic Oscillators have resorted to a path of pointing to the moon tactically, indicating that partakers are gaining stronger bullish stances positively and confidently. The Bollinger Bands have had a set of candlesticks denoting that lower highs are consistently and gradually increasing.
Will WSM/USD Sustain Momentum as Price Firms Up, Raising Incremental Hikes Inputting?
The WSM/USD trade’s chart structure suggests strengthening accumulation, with firming price action supporting incremental hikes. Buyers appear positioned to extend dominance, while technical indicators reinforce sustained momentum, cautioning against premature bearish bets amid evolving bullish traction.
Position staking of the WSM/USD base instrument is highly recommended, as firming price action signals continued accumulation strength. Gradual price hikes strengthen bullish confidence and support ongoing upward momentum. Indicators show an improving market structure with limited downside risk, making strategic long positions currently an attractive opportunity.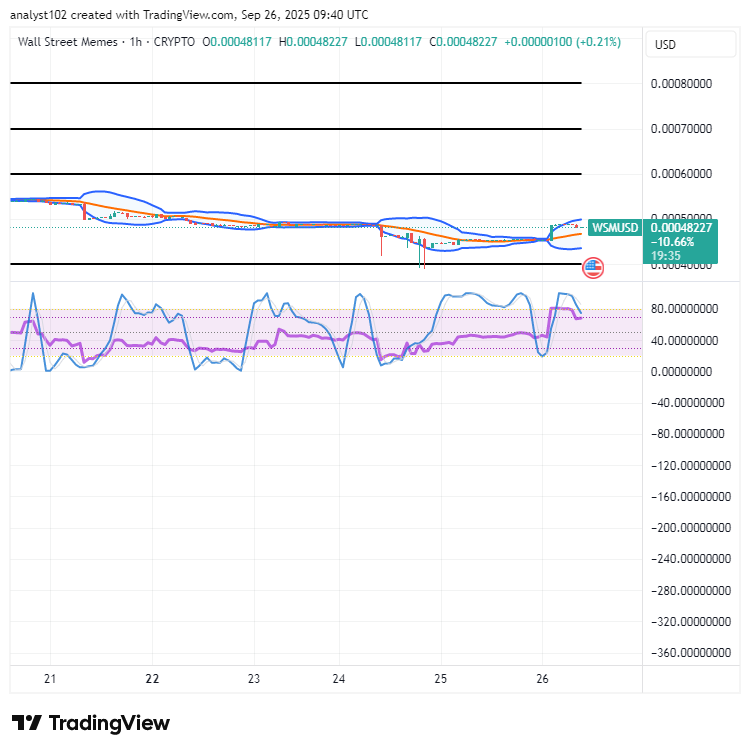
WSM/USD 1-hour chart
The 1-hour chart of the WSM/USD market firms up above $0.0004, raising incremental hikes inputting.
The Bollinger Bands trend lines have compressed downward, positioning within the $0.0005–$0.0004 range. In the meantime, the Stochastic Oscillators have turned north into the overbought region, signaling that buyers are actively strategizing for sustained control.
Explore fresh trading opportunities with flexible 1–25x leverage. WSM and BIGTIME are now live on Bybit Futures Grid Bot, giving traders enhanced tools to capture volatility and maximize potential gains. Start trading today!
🚀 BIGTIMEUSDT & WSMUSDT Contracts now on Bybit!
— Bybit (@Bybit_Official) October 12, 2023
Dive into new trading opportunities with 1-25x leverage. Plus, they’re now on Bybit Futures Grid Bot! Start trading now.
📈 BIGTIME: https://t.co/FAQlbhnzAh
📈 WSM: https://t.co/pb2y2AfMBE#CryptoTrading #Bybit