Polygon (MATIC/USD) Price Struggles to Average $1.10
Estimated Reading Time: 3 minutes
Don’t invest unless you’re prepared to lose all the money you invest. This is a high-risk investment and you are unlikely to be protected if something goes wrong. Take 2 minutes to learn more
Polygon Price Prediction – January 15
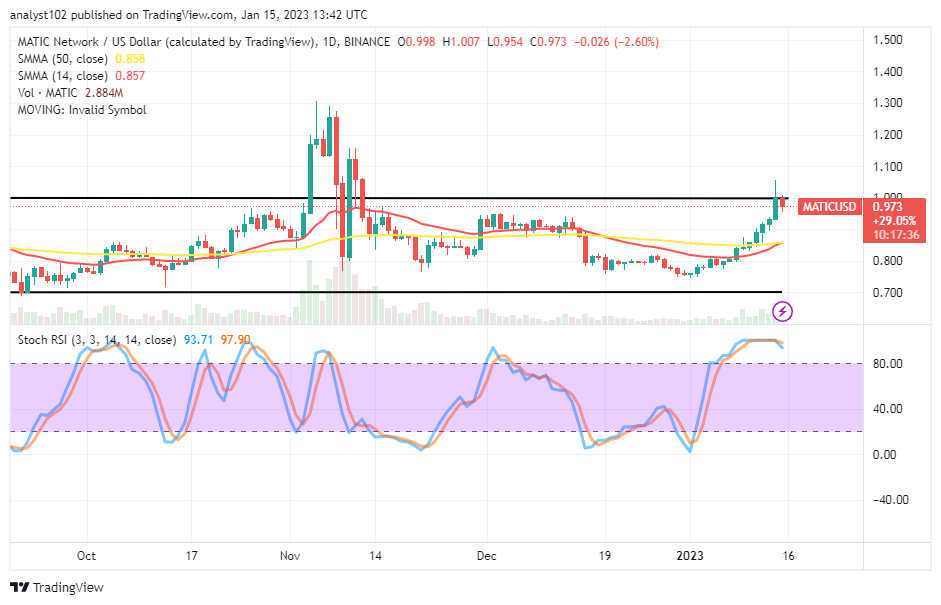
A lot of striving efforts have been in the approach of the MATIC/USD market bulls as the crypto’s price struggles to average the $1.10 resistance line. Higher-resistance trading zones have achieved between $1.007 and $0.954 points. Price is currently trading at $0.973 with a negative of 2.60 percent, indicating that buying will soon lose momentum.
MATIC/USD Market
Key Levels
Resistance levels: $1.10, $1.15, $1.20
Support levels: $0.85, $0.80, $0.75
MATIC/USD – Daily Chart
It currently showcases on the MATIC/USD daily chart that the crypto’s price struggled to average the $1.10 resistance level during yesterday’s trading session. Todays’s operations have had a bearish candlestick, featuring against the $1 trading level to the downside at the upper range line drawn in the long-term run. The lower range line is at the $0.70 support level beneath the SMA trend lines of the 14-day and the 50-day. The Stochastic Oscillators are in the overbought region, demonstrating a slight-southbound crossing posture at 97.90 and 93.71 levels to suggest that a dropping move is imminent.
Will MATIC/USD traders quickly cultivate the idea of executing sell bets below or near $1.10?
The MATIC/USD traders may begin to launch instant shorting orders around or below the $1.10 resistance level as the price has struggled to average the value line in the recent cycle of upsurges. From the technical viewpoint, any further attempted upsprings in the valuation of the crypto economy will likely encounter reversal-moving mode around the mentioned earlier. Therefore, long-position placers are to suspend their actions for a while.
On the downside of the technical analysis, as there had been a sign on yesterday’s trading candlestick that ended with a top shadow pattern below the $1.10 resistance level, it serves as a warning sign against getting sustainable more ups around that trading capacity in the long run. As a result, sellers should brace themselves for a shorting entry point in the following active operations. In the meantime, an instant sell order with a stop loss order can be around the $1.15 barrier level can be opened.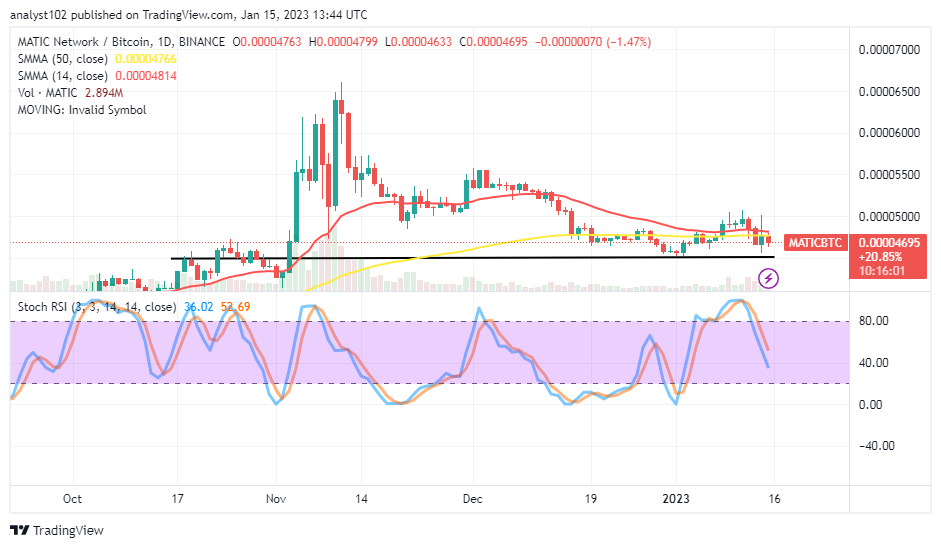
MATIC/BTC Price Analysis
In contrast, Polygon’s trending velocity against Bitcoin appears, giving in to a correction with less-active moving modes against the trend lines of the SMAs. During yesterday’s trading, the price of the paired crypto market struggled to average a near psychological resistance zone before resuming a downward trend. The 14-day SMA indicator is closely over the 50-day SMA trend line. The Stochastic Oscillators have crossed southbound from the overbought region to 52.69 and 36.02 levels. The Stochastics’ posture suggests that the trend to the decreasing path is still reasonably ongoing.
Note: Cryptosignals.org is not a financial advisor. Do your research before investing your funds in any financial asset or presented product or event. We are not responsible for your investing results.
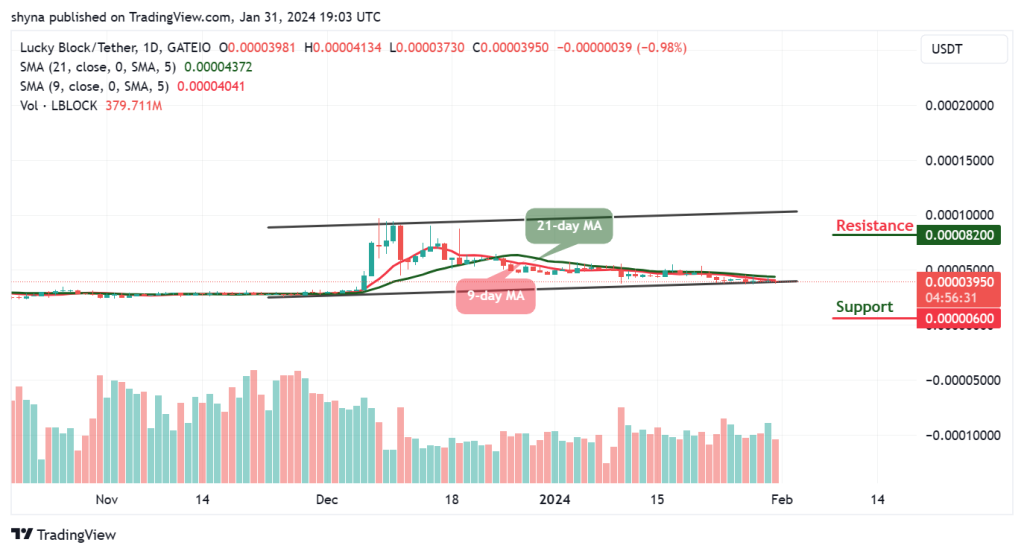
You can purchase Lucky Block here. Buy LBLOCK