XRP Remains Static as It Tries to Cross the $0.65 Barrier
Estimated Reading Time: 2 minutes
Don’t invest unless you’re prepared to lose all the money you invest. This is a high-risk investment and you are unlikely to be protected if something goes wrong. Take 2 minutes to learn more

XRP (XRP) Long-Term Analysis: Ranging
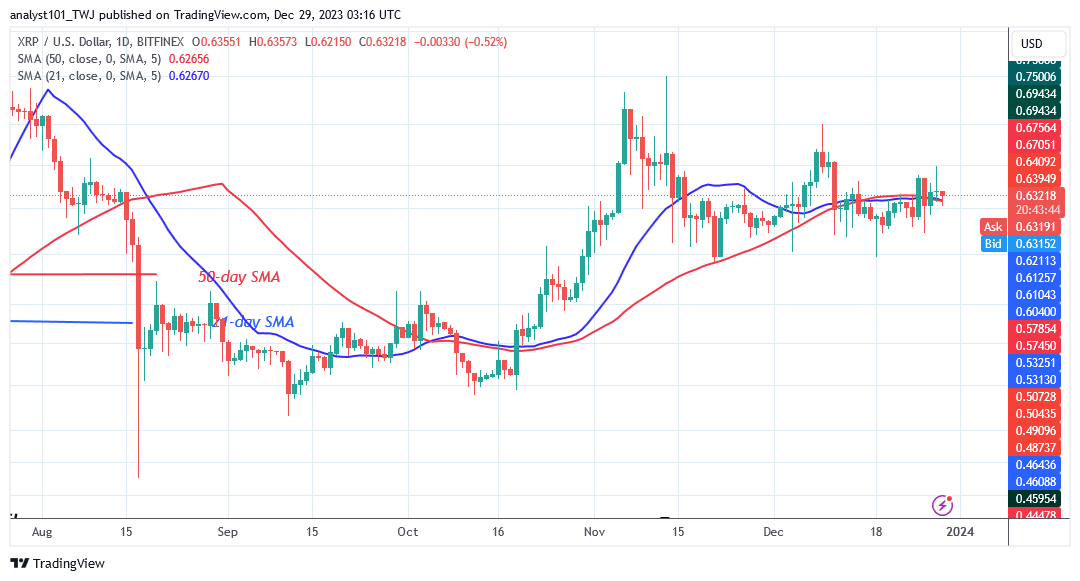
Since the December 11 price dip, XRP (XRP) has been trading sideways as it tries to cross the $0.65 barrier. The altcoin is now trading in a range and above the moving average lines. On the upside, the barrier at $0.65 has stopped the upward movement. Furthermore, the candlesticks have lengthy wicks, which suggest significant selling pressure at higher price levels.
The price of XRP is $0.63 at the time of writing. The coin will resume its upward trend once it breaks through the barrier level at $0.65. The altcoin’s price will grow and reach historical highs of $0.72 and $0.85. If the bears breach the moving average lines, XRP/USD will retrace to its previous $0.61 low.
Technical Indicators:
Major Resistance Levels – $1.00, $1.50, $2.00
Major Support Levels – $0.50, $0.30, $0.10
XRP (XRP) Indicator Analysis
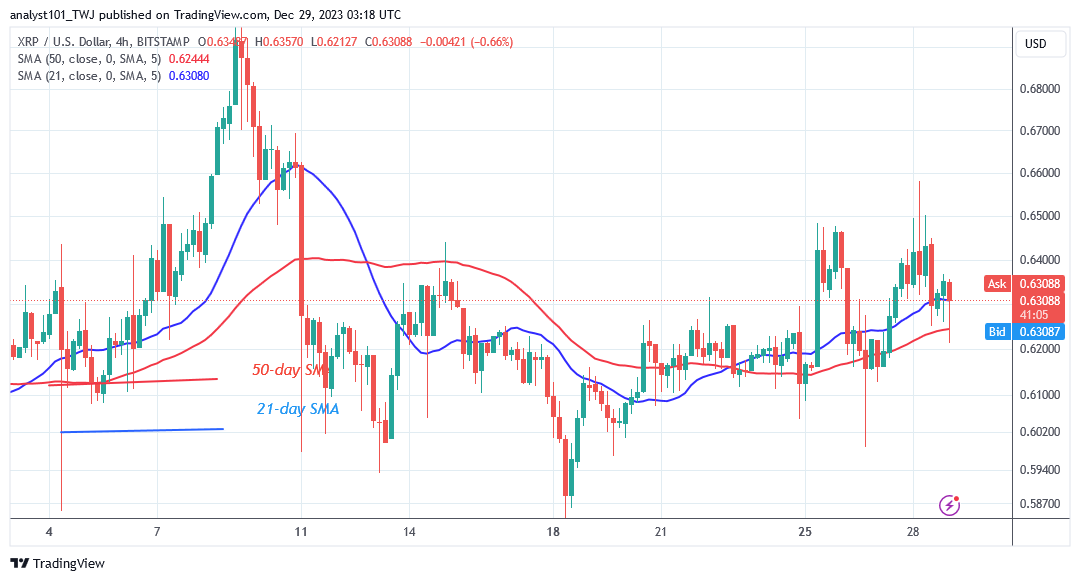
The price bars are above the horizontal moving average lines. The altcoin will strive to rise as long as the price bars remain above the moving average lines. The altcoin has remained static due to the existence of Doji candlesticks. In addition, price fluctuation has been restricted to a narrow range.
What Is the Next Direction for XRP (XRP)?
The crypto’s price is currently between $0.61 and $0.65 as it tries to cross the $0.65 barrier. The coin is trading in the middle of the price range, above the moving average lines. The altcoin is currently in decline, with bears attempting to break below the moving average lines. The cryptocurrency will rise if the 21-day SMA support holds.
You can purchase crypto coins here. Buy LBLOCK
Note: Cryptosignals.org is not a financial advisor. Do your research before investing your funds in any financial asset or presented product or event. We are not responsible for your investing results