Tamadoge (TAMA/USD) Gains Strength and Eyes $0.0055 Resistance After Surging from $0.00515
Estimated Reading Time: 3 minutes
Don’t invest unless you’re prepared to lose all the money you invest. This is a high-risk investment and you are unlikely to be protected if something goes wrong. Take 2 minutes to learn more
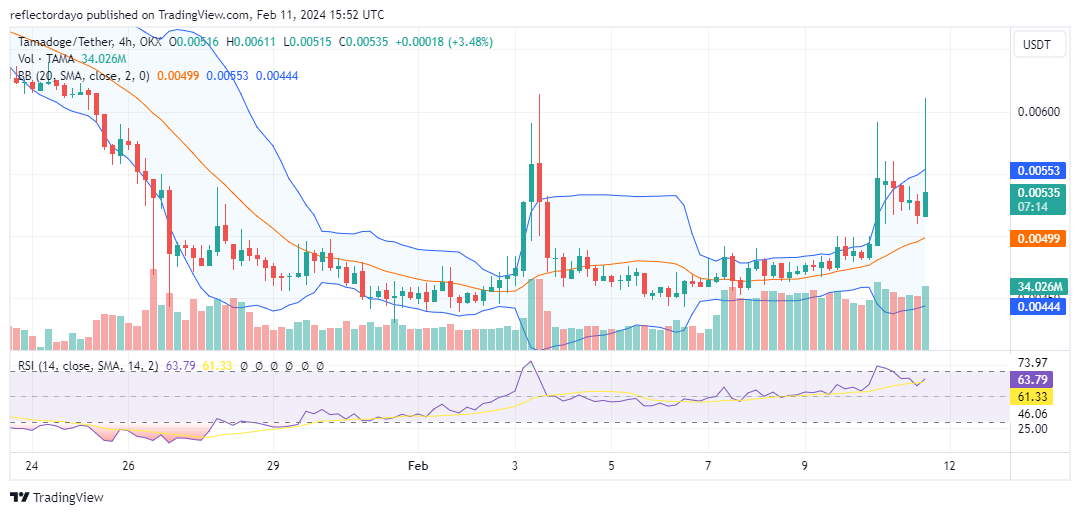
As forecasted in our previous analysis, the TAMA/USD price initiated an upward surge from the $0.0045 support level on February 6th. By February 10th, the bullish market sentiment attracted increased investor participation, leading to heightened liquidity and a breakout above the $0.005 resistance level, with prices briefly testing $0.006. However, a shift in liquidity towards bearish sentiment ensued due to profit-taking activities around the $0.006 level. In today’s market, bulls identified stronger support at $0.00515.
Key Levels
- Resistance: $0.013, $0.014, and $0.015.
- Support: $0.0045, $0.0040, and $0.0035.
TAMA/USD Price Analysis: The Indicators’ Point of View
The Bollinger Bands indicator depicted the strengthening momentum of the TAMA/USD bull market and the escalating volatility levels. This occurred on February 10th, as heightened liquidity within the bull market led to an increase in the bandwidth of the Bollinger indicator. Additionally, the crypto signal continues to exhibit an upward trending price channel, reflecting the resilience of bulls who rebounded at $0.00515, resulting in upward movements in both the standard deviation curves and the 20-day moving average.
However, the persistent upper shadows on the candlesticks since February 10th suggest that the resistance level at $0.005 is formidable and may present a significant challenge to the ascending bull market. Nevertheless, the establishment of a support level at $0.00515 strategically positions the market to apply pressure to bearish positions at this level. The current market volatility presents an opportunity for bulls to potentially break through the resistance level with relative ease.
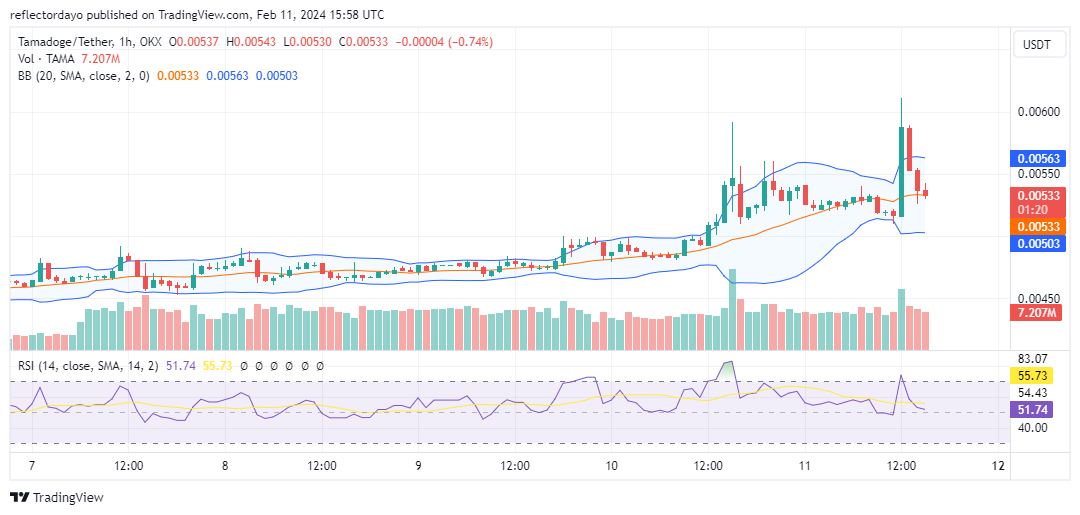
Tamadoge Short-Term Outlook: 1-Hour Chart
However, based on the 1-hour chart analysis of the TAMA/USD market, the bearish momentum appears to be consolidating within a range, yet the bullish forces are maintaining their stance, resulting in a market currently at equilibrium. As the RSI line of the Relative Strength Index approached the midpoint, indicating a reduction in momentum, it began oscillating around the 52 level. With the bullish position holding firm at the $0.00515 support level, there’s a possibility that bullish momentum will soon resume, potentially leading to a breakout above the $0.0055 resistance level.
Polygon is currently home to the Tamaverse.
The Tamaverse is now on @0xPolygon
💎 Low gas fees to claim $TAMA prizes
💎 Low gas fees to level up your NFTs
💎 Low gas fees to stake your earningsPlay and earn more on Tamadoge Arena now 👇
📱 Android: https://t.co/INCaGendE4
📱 iOS: https://t.co/Fj9tT5Oicu pic.twitter.com/hUw4FX4sag— TAMADOGE (@Tamadogecoin) February 9, 2024
Do you want a coin that will be 100 times more valuable in the next few months? That is Tamadoge. Buy TAMA today!