Tamadoge (TAMA/USD) Price Rally Anticipated as Investors Gather Around $0.00045 Level
Estimated Reading Time: 3 minutes
Don’t invest unless you’re prepared to lose all the money you invest. This is a high-risk investment and you are unlikely to be protected if something goes wrong. Take 2 minutes to learn more
The Tamadoge market has remained relatively stagnant, maintaining a sideways trajectory around the $0.00045 price level for some time. However, recent developments suggest a potential upward price surge. There is a noticeable influx of traders on both sides of the market, indicating increased activity among both bulls and bears. As a result, the market forces are now more evenly balanced, potentially setting the stage for significant movement.
Key Levels
- Resistance: $0.013, $0.014, and $0.015.
- Support: $0.0045, $0.0040, and $0.0035.
TAMA/USD Price Analysis: The Indicators’ Point of View
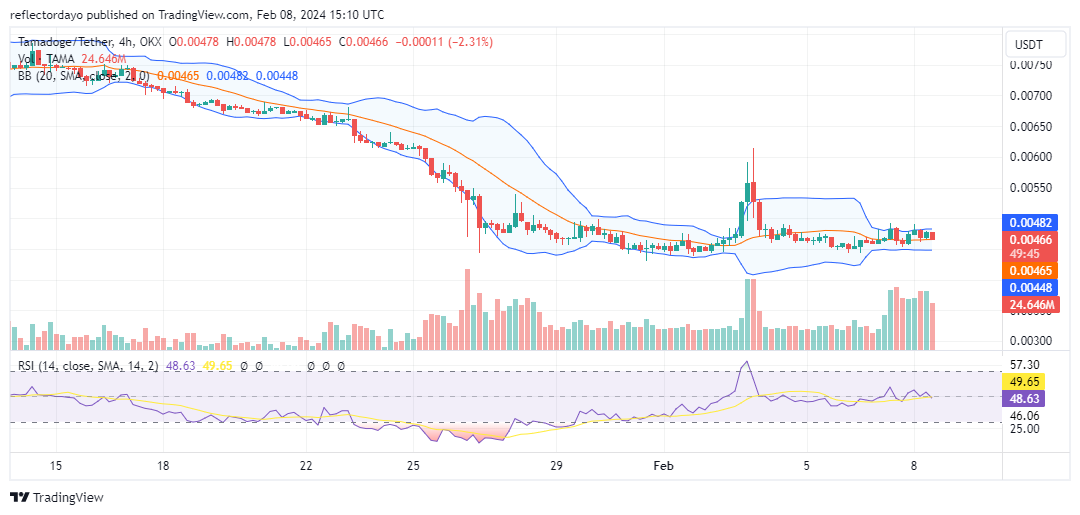
The Bollinger Bands indicator depicts a volatility squeeze marked by the convergence of its bands into a narrower bandwidth, reflecting a tightening price channel as bullish and bearish forces reach parity. Concurrently, the volume of trade indicator shows a surge in investor interest, evident in the substantial increase in histograms. Despite this heightened activity, the price action remains confined within an eastward-bound price channel movement, indicating a state of indecision in the market.
While the observation of this crypto signal holds true, the fact that the Tamadoge price action is consolidating around the $0.00045 price level suggests an imminent bounce. Historically, this level has consistently repelled bearish advances since January 26th, reinforcing its significance in market dynamics.
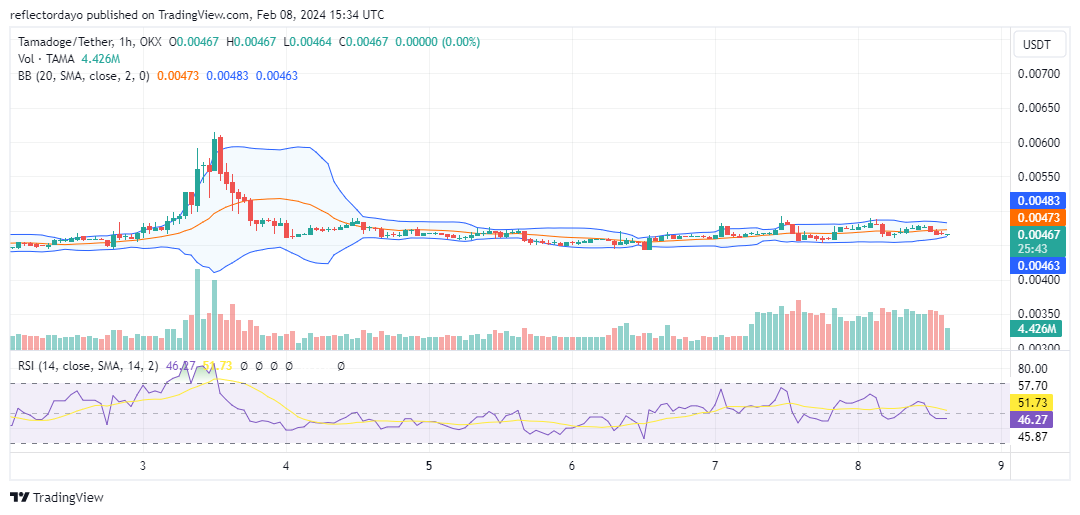
Tamadoge Short-Term Outlook: 1-Hour Chart
In fact, based on the 1-hour chart analysis, the Tamadoge market has shown a subtle upward trend. While this movement has been minimal and somewhat imperceptible, it signifies a gradual increase in bullish momentum. Despite the ongoing consolidation within a narrow price channel, there are indications of a slight shift favoring the bulls. Investors should be prepared to capitalize on buying opportunities at this price level to maximize potential profits.
TAMA will stop accepting deposits and withdrawals on February 7 at 2:00 am UTC.
🐶 Important Update #TamaArmy 🐶@okx will support $TAMA token migration
⏰ TAMA deposits and withdrawals will be suspended at 2:00 am UTC on February 7.
📈 $TAMA trading will not be affected.
Read more here 👉 https://t.co/bnhgk8HGsf pic.twitter.com/A26l9skBuM
— TAMADOGE (@Tamadogecoin) February 6, 2024
Do you want a coin that will be 100 times more valuable in the next few months? That is Tamadoge. Buy TAMA today!