Tamadoge (TAMA/USD) Bulls Show Optimism as They Face Off Against Bears in a Standoff
Estimated Reading Time: 3 minutes
Don’t invest unless you’re prepared to lose all the money you invest. This is a high-risk investment and you are unlikely to be protected if something goes wrong. Take 2 minutes to learn more
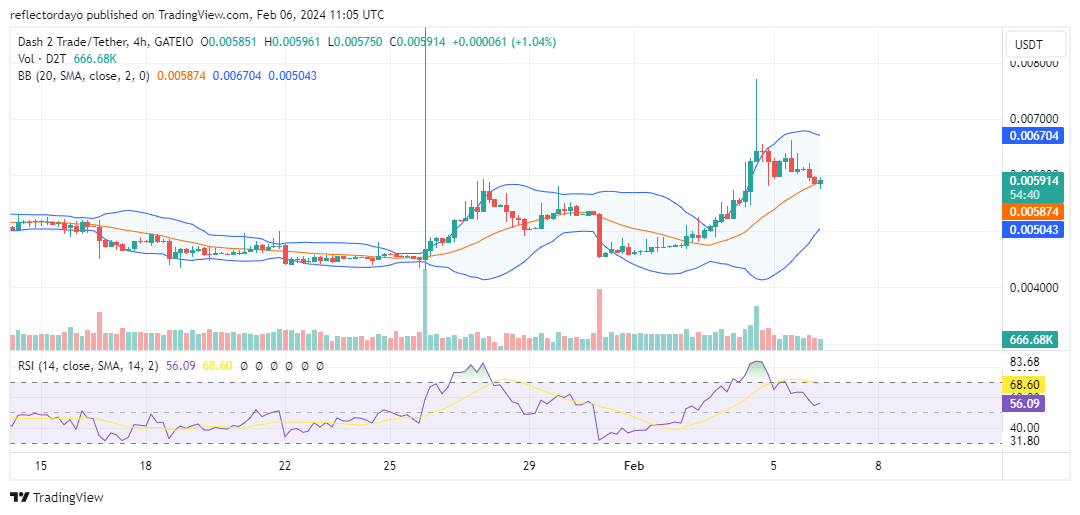
In response to persistent selling pressure, TAMA/USD bullish traders have successfully maintained the price action above the $0.0045 level. However, the heightened activity from bearish participants has contributed to sustained market volatility. Despite this volatility, investor interest remains robust and encouraging. As a result, the market continues to exhibit fluctuations.
Key Levels
- Resistance: $0.013, $0.014, and $0.015.
- Support: $0.0045, $0.0040, and $0.0035.
TAMA/USD Price Analysis: The Indicators’ Point of View
Due to heightened volatility, the Bollinger Bands indicator has consistently maintained a significant bandwidth since February 3rd. This volatility stems from the ongoing conflict between bullish and bearish sentiments. While bearish pressure has strengthened above the $0.006 price level, bullish traders have demonstrated resilience, firmly supporting the $0.0045 level. Additionally, bullish sentiment remains optimistic regarding the $0.0045 price level. This clash between opposing forces has resulted in a period of ranging or consolidating price action, despite the elevated volatility. The presence of such high volatility amidst indecision is indicative of active participation from both sides of the market. Consequently, it suggests the potential for a definitive TAMA/USD price movement in the near future.
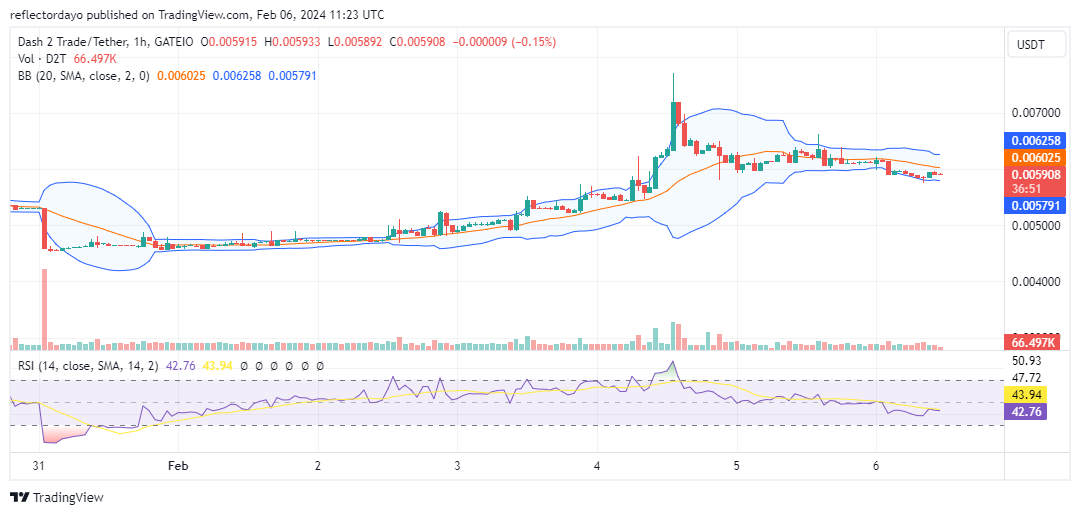
Tamadoge Short-Term Outlook: 1-Hour Chart
In contrast to the broad bandwidth observed on the 4-hour chart reflecting market outlook, the 1-hour chart depicts movement within a narrow price channel as indicated by the Bollinger Bands indicator. Despite conflicting crypto signals between these two timeframes, valuable insights can still be gleaned. Should the choppy price actions persist on the 1-hour chart, it’s conceivable that the overall volatility across timeframes, as depicted on the 4-hour chart, may diminish. This scenario could potentially precipitate a shift in market dynamics, favoring upward price movement. Historically, the $0.0045 price level has served as a significant support level, further supporting this anticipated shift.
Tamadoge is moving on to the Polygon chain.
We’re excited to announce that Tamadoge is moving to Polygon! Read the details in this thread or on our discord. 1/8 pic.twitter.com/PjgxJa8TDa
— TAMADOGE (@Tamadogecoin) January 29, 2024
Do you want a coin that will be 100 times more valuable in the next few months? That is Tamadoge. Buy TAMA today!


