XRP Slumps to $0.57 As Bulls Pounce On Dips
Estimated Reading Time: 2 minutes
Don’t invest unless you’re prepared to lose all the money you invest. This is a high-risk investment and you are unlikely to be protected if something goes wrong. Take 2 minutes to learn more

XRP (XRP) Long-Term Analysis: Bearish
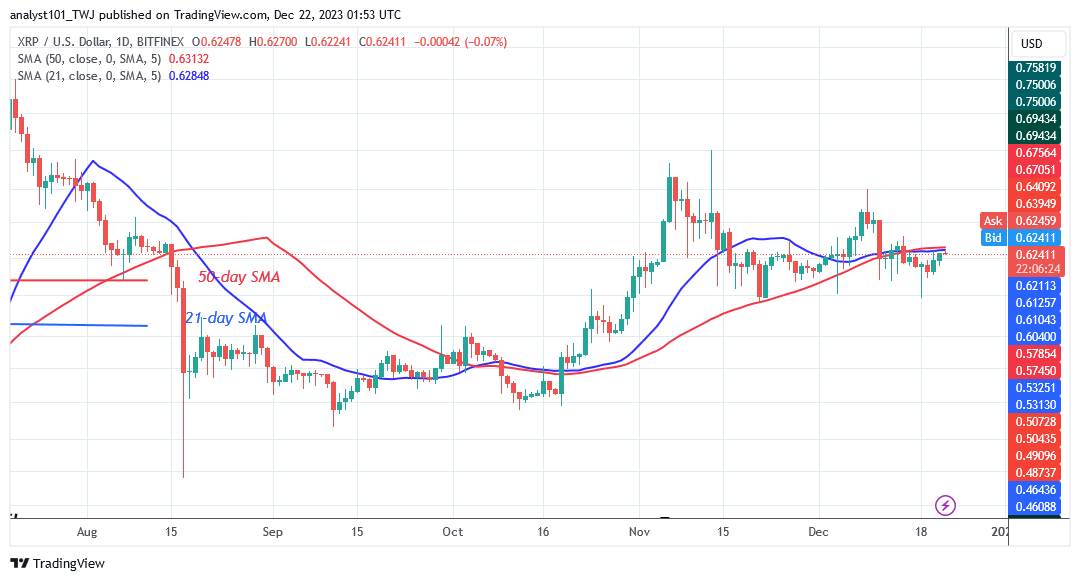
The price of XRP (XRP) has fallen below the moving average lines as bulls pounce on dips. On December 11, the altcoin hit a low of $0.59 as bulls pounced on dips. Buyers tried and failed to push the altcoin above the moving average lines, but were repulsed at the high of $0.64. On December 18, XRP fell further to a low of $0.57 as bulls rushed in to buy the dips.
On December 18, the lengthy candlestick tail signals significant purchasing at a lower price level. Nonetheless, the crypto’s price has stopped below the moving average lines, indicating that the upward corrective has failed. XRP/USD will be forced to trade above the $0.57 support but below the moving average lines.
The altcoin’s price will continue to rise if it breaks above the moving average lines.
Technical Indicators:
Major Resistance Levels – $1.00, $1.50, $2.00
Major Support Levels – $0.50, $0.30, $0.10
XRP (XRP) Indicator Analysis
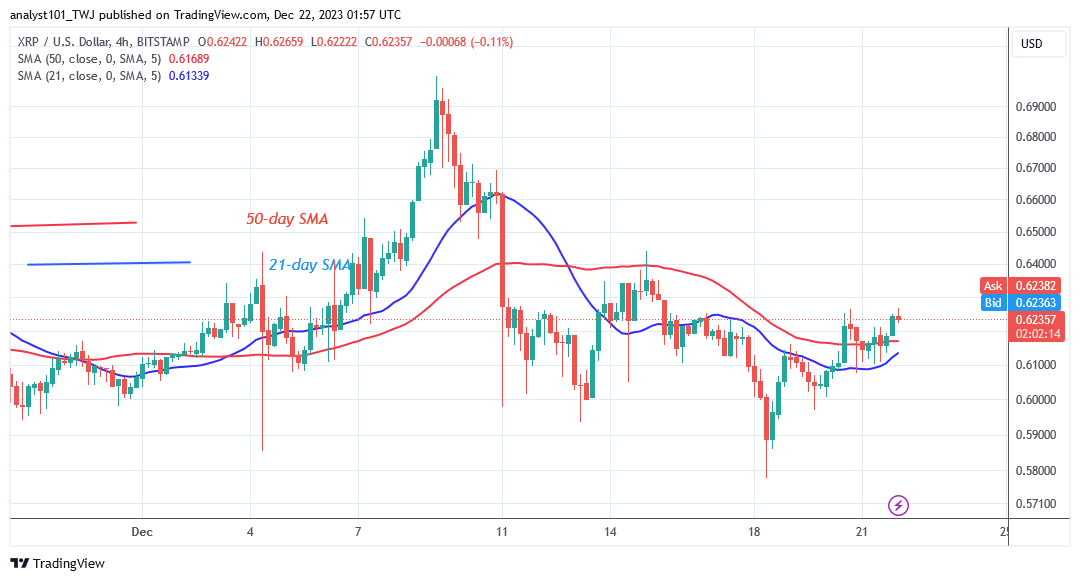
Following the current decrease on December 18, the altcoin’s price is now below the moving average lines. The altcoin will resume selling pressure if it is rebuffed at the moving average lines. Since the termination of the uptrend on November 6, the moving average lines have been horizontal. The price bars on the 4-hour chart are above the moving average lines.
This will lead the cryptocurrency to rise, but it will be rejected at its recent high.
What Is the Next Direction for XRP (XRP)?
The crypto asset has slipped below the moving average lines on the daily chart as bulls pounce on dips. This means that the altcoin will be trading in a bearish trend zone. The coin is now trading between $0.57 and $0.62 per coin. When the present levels are broken, the altcoin will trend.
You can purchase crypto coins here. Buy LBLOCK
Note: Cryptosignals.org is not a financial advisor. Do your research before investing your funds in any financial asset or presented product or event. We are not responsible for your investing results