XRP Is on the Rise but Faces Resistance at $0.63
Estimated Reading Time: 2 minutes
Don’t invest unless you’re prepared to lose all the money you invest. This is a high-risk investment and you are unlikely to be protected if something goes wrong. Take 2 minutes to learn more

XRP (XRP) Long-Term Analysis: Bullish
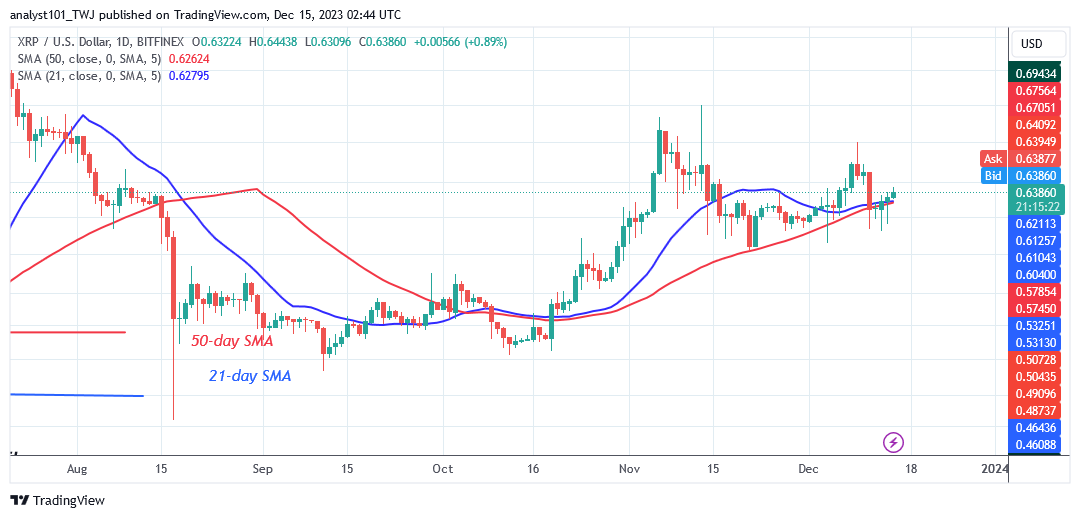
The price of XRP (XRP) is back on the rise after a recent decline but faces resistance at $0.63. The cryptocurrency crashed to a low of $0.59 as bulls bought dips. The altcoin hit a high of $0.63 at the time of writing. On the plus side, the bullish momentum is likely to be met with resistance near the high of $0.65. The rejection at $0.65 on December 9 prompted the altcoin to fall below the moving average lines.
On the plus side, if the bulls break through the resistance levels of $0.65 and $0.75, the market will rise to a high of $0.85. Meanwhile, XRP/USD is trading above the moving average lines.
Technical Indicators:
Major Resistance Levels – $1.00, $1.50, $2.00
Major Support Levels – $0.50, $0.30, $0.10
XRP (XRP) Indicator Analysis
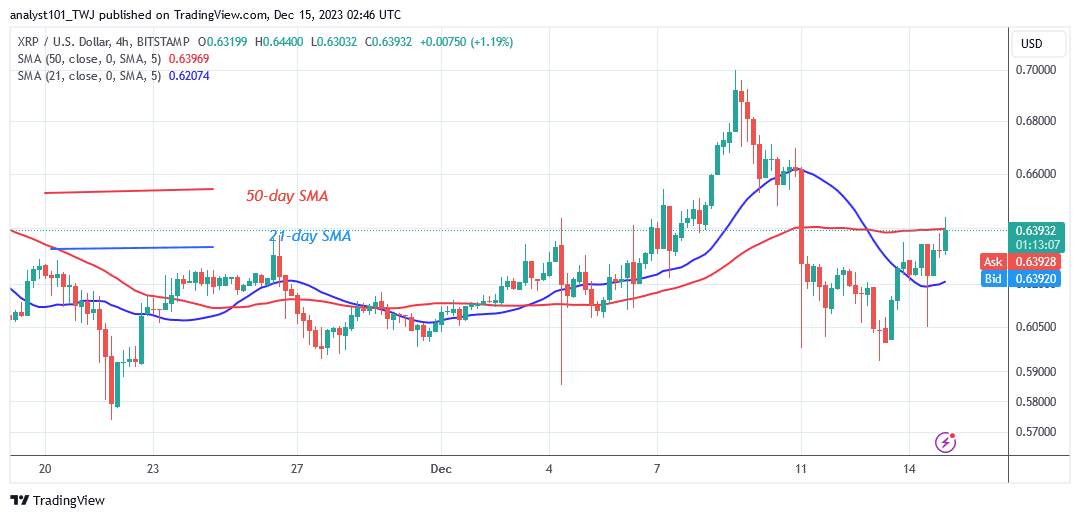
The altcoin is increasing as price instances rise again above the moving average lines. Doji candlesticks have been present, which has limited price movement. XRP is caught between the moving average lines on the 4-hour chart. It suggests that the altcoin will resume its sideways movement above the moving average lines.
What Is the Next Direction for XRP (XRP)?
The crypto asset is resuming its bullish trajectory but faces resistance at $0.63. The altcoin’s upward trend is being hampered by the resistance at the high of $0.63. If the price maintains above the 21-day SMA, the cryptocurrency’s price will advance to previous highs. The lengthy tail of the candlestick on December 11 and 13 signal heavy purchasing at lower price levels.
You can purchase crypto coins here. Buy LBLOCK
Note: Cryptosignals.org is not a financial advisor. Do your research before investing your funds in any financial asset or presented product or event. We are not responsible for your investing results