UMA (UMAUSD) Is Being Pressured Downward
Estimated Reading Time: 2 minutes
Don’t invest unless you’re prepared to lose all the money you invest. This is a high-risk investment and you are unlikely to be protected if something goes wrong. Take 2 minutes to learn more

Free Crypto Signals Channel
UMA Analysis: The market is under pressure to drop lower
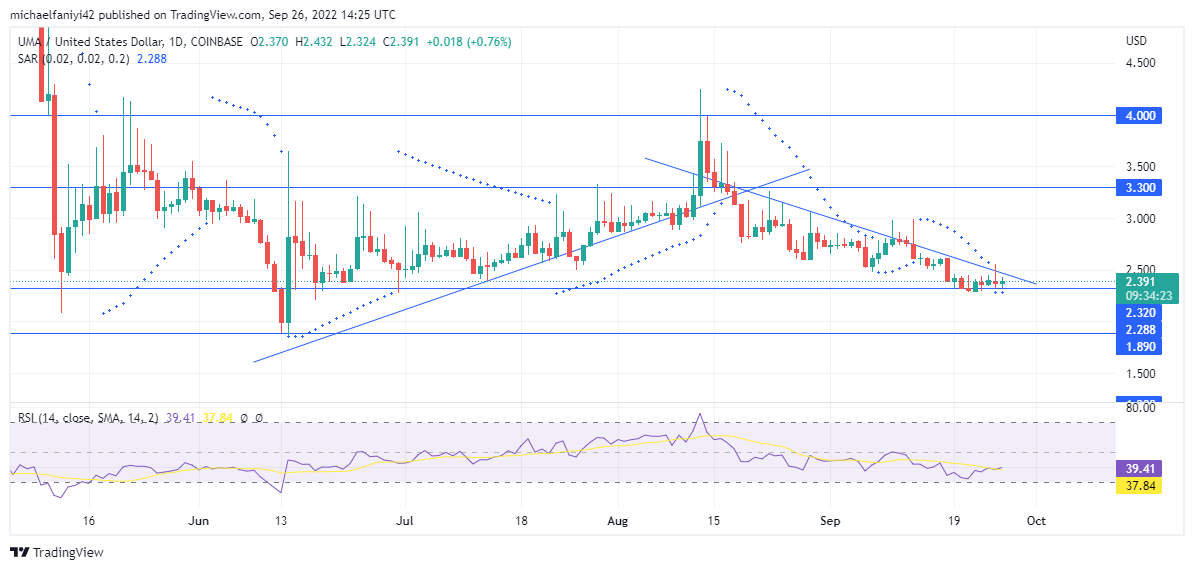
UMA is being pressured to keep moving downward. The price recently rose from a support level of $2.320 to a high of $4,000. Despite the demonstrations of strength, the mechanisms could not hold the price up. Therefore, a swift downtrend ensued. The coin was pressurized till it fell back to the $2.320 key level, where it began. The price is still on a decline.
UMAUSD Significant Zones
Resistance Levels: $4.000, $3.300
Support Levels: $2.320, $1.890
The coin could not hold above the significant levels of $4.000 or $3.300 when it surged upwards to those levels. The sellers are now hitting the market hard by plunging it back to the $2.320 support level. Little is being done to shift the strain by the sell-traders, so the best aid for the market rests on the strength of the $2.320 support level.
The Relative Strength Index (RSI) line has gradually nosedived to the bearish region of its chart. However, the line has bounced off the border of the oversold region, giving some hope to the bulls. The Parabolic SAR (Stop and Reverse) rests above the daily candlesticks to suggest the bearish trend in the market.
Market Expectation
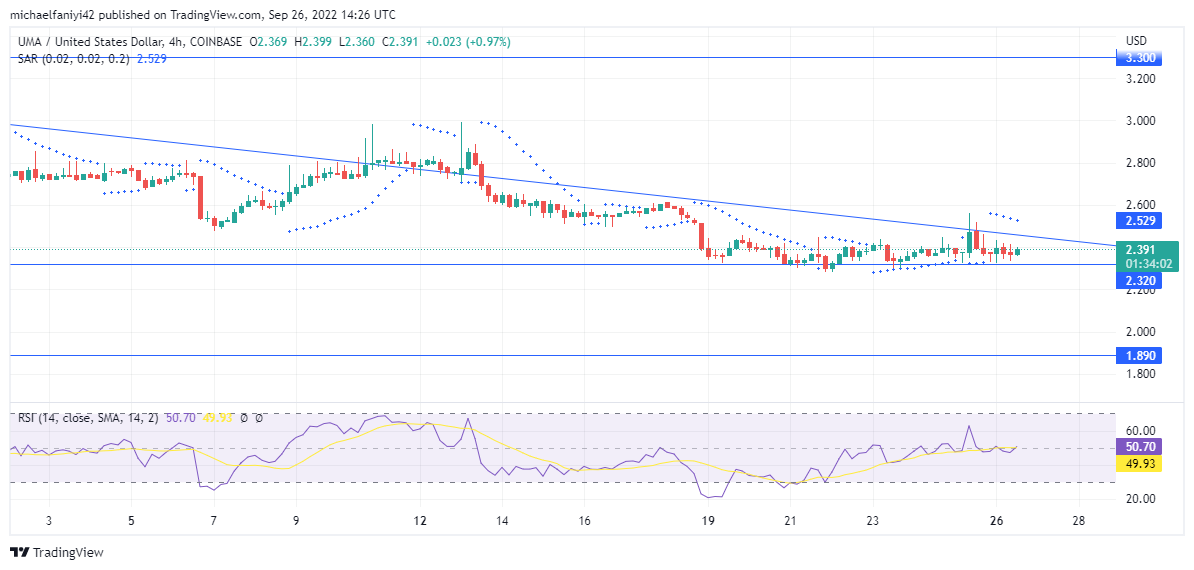
For the first time in a while, long Parabolic SAR dots have lined up below the market on the 4-hour chart. This signals a reprieve for the buyers as they seek to overturn the market. Also, the Relative Strength Index line is on the rise and has now touched the middle line.
UMAUSD is expected to hold above the $2.320 support level and, from there, try to test the $3.300 resistance again.
You can purchase Lucky Block here. Buy LBLOCK
Note: Cryptosignals.org is not a financial advisor. Do your research before investing your funds in any financial asset or presented product or event. We are not responsible for your investing results.

