Polygon (MATIC/USD) Market Trades Under $1
Estimated Reading Time: 3 minutes
Don’t invest unless you’re prepared to lose all the money you invest. This is a high-risk investment and you are unlikely to be protected if something goes wrong. Take 2 minutes to learn more
Polygon Price Prediction – October 30
The polygon price valuation against the US Dollar market trades under the $1 resistance line, serving as the main barrier-high trading point over time. There have been a record of the high and the low-value lines of $0.935 and $0.923 on the crypto’s financial book as it keeps a minor negative percentage rate of 0.11.
MATIC/USD Market
Key Levels
Resistance levels: $1, $1.05, $1.10
Support levels: $0.80, $0.75, $0.70
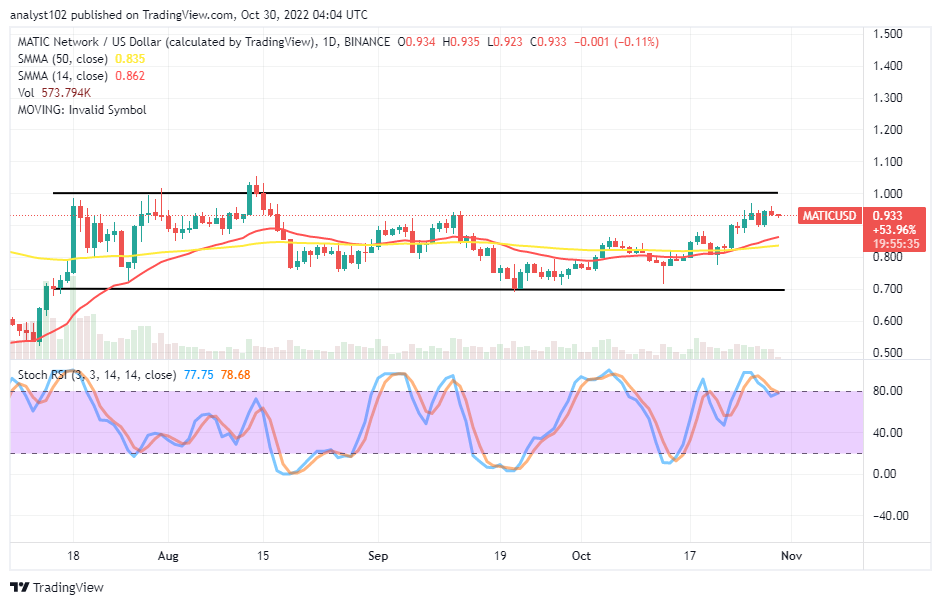
MATIC/USD – Daily Chart
The daily chart showcases the MATIC/USD market trades under the $1 resistance level. All All the trading candlesticks are within range zones of $1, $0.90, $0.80, and $0.70 value lines. The 14-day SMA indicator is at $0.862, above the $0.835 value point. The Stochastic Oscillators have slightly moved southbound to reposition at the range values of 78.68 and 77.75. And they are trying to close their lines in a manner capable of suggesting an upward motion is on the verge of losing momentum.
Will the MATIC/USD market succumb to a declining force underneath or around the $1?
The MATIC/USD market appears not to push past the $1 resistance level as the crypto’s price trades under the value line over a couple of sessions. Currently, trading operations may be suspended for a while in the area of its current trading zone before starting a retracement toward the SMAs. And, if that presumption eventually plays out as aimed, long-position placers will find a base point to re-swing into an upward trend that will generate a closure trading capacity to break out around the figure amount in question afterward.
On the downside of the technical analysis, the MATIC/USD trade sellers needed to be on the lookout for a selling activity that may occur around the upper horizontal line drawn around the $1 resistance level. It has been that a candlestick convergence has been building at a high point over the SMA indicators. And that is more supportive that bears will soon take over the control at the expense of bulls’ possibility of not sustainably moving out of the long-range-bound zones they have maintained.
MATIC/BTC Price Analysis
In comparison, Polygon remains strong against the trending ability of Bitcoin to a large extent. The pairing crypto market trades under the B0.00005 resistance level for quite a while above the trend line of the bigger SMA. The 14-day SMA indicator is over the 50-day SMA indicator. The Stochastic Oscillators have swerved southbound from the range of 80 to 47.36 and 40.10 range points. Both bull and bear are to be cautious of exerting a position at this point. However, the base crypto tends to shift its stance to the downside to regain support around the supportive bullish trend line drawn below the 14-day SMA indicator.
Note: Cryptosignals.org is not a financial advisor. Do your research before investing your funds in any financial asset or presented product or event. We are not responsible for your investing results.
You can purchase Lucky Block here. Buy LBLOCK