Livepeer (LPT/USD) Gains Momentum: Is This the Start of a Bull Run?
Estimated Reading Time: 3 minutes
Don’t invest unless you’re prepared to lose all the money you invest. This is a high-risk investment and you are unlikely to be protected if something goes wrong. Take 2 minutes to learn more
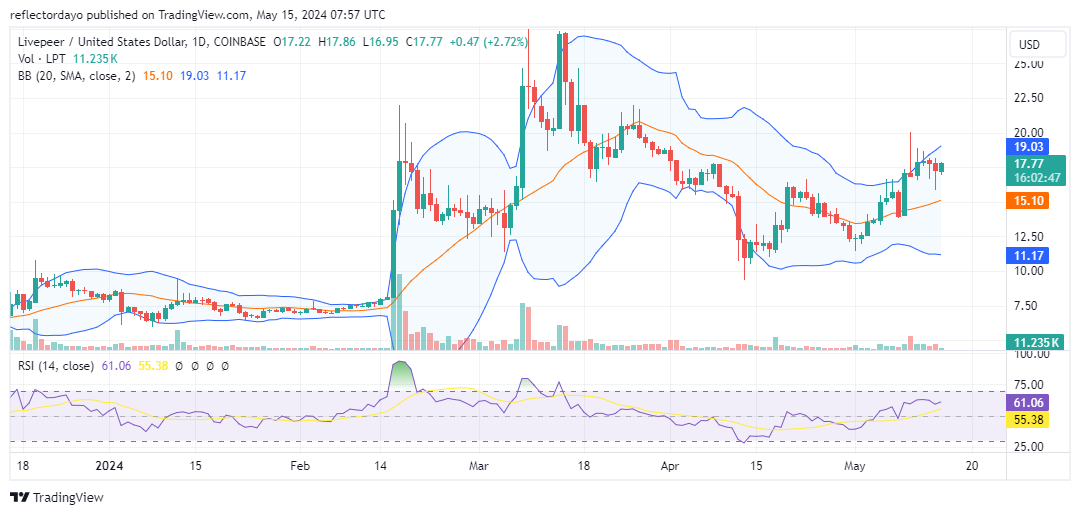
The Livepeer market is presently demonstrating bullish momentum, evident from the consistent formation of higher lows subsequent to the establishment of a pivotal support level at $10. This level attracted bullish interest, prompting buying activity. However, the current bull market appears to be encountering some resistance around the $17.50 price mark as selling pressure starts to balance out with buying pressure. It is conceivable that, akin to previous instances, another higher support level could emerge from this juncture in the Livepeer market.
Livepeer Market Data
- LPT/USD Price Now: $17.81
- LPT/USD Market Cap: $572 million
- LPT/USD Circulating Supply: 32 million LPT
- LPT/USD Total Supply: 32 million LPT
- LPT/USD CoinMarketCap Ranking: #115
Key Levels
- Resistance: $19.00, $20.00, and $21.00
- Support: $16.00, $15.50, and $15.00.
Livepeer Through the Lens of Indicators
The upward trajectory embarked upon by the market commenced on April 13 and has since been sustained, with bullish intervention occurring at progressively higher price points. Drawing from the historical performance of this market, should a downturn occur, it is likely that bulls will step in around the $15.85 price level to establish another series of higher lows.
Regarding the crypto signal provided by the Bollinger Bands indicator, it has already begun to depict an ascending price channel, as evidenced by the upward trend of the bands. However, due to heightened market volatility around the $17.50 and $20.00 price thresholds, there appears to be an impact on the lower standard deviation, causing it to diverge downward owing to substantial resistance from the bear market. Nonetheless, the swift and pronounced buying activity witnessed as the price approached levels below $17.50 indicates the robust bullish bias prevalent in this market below said price level.
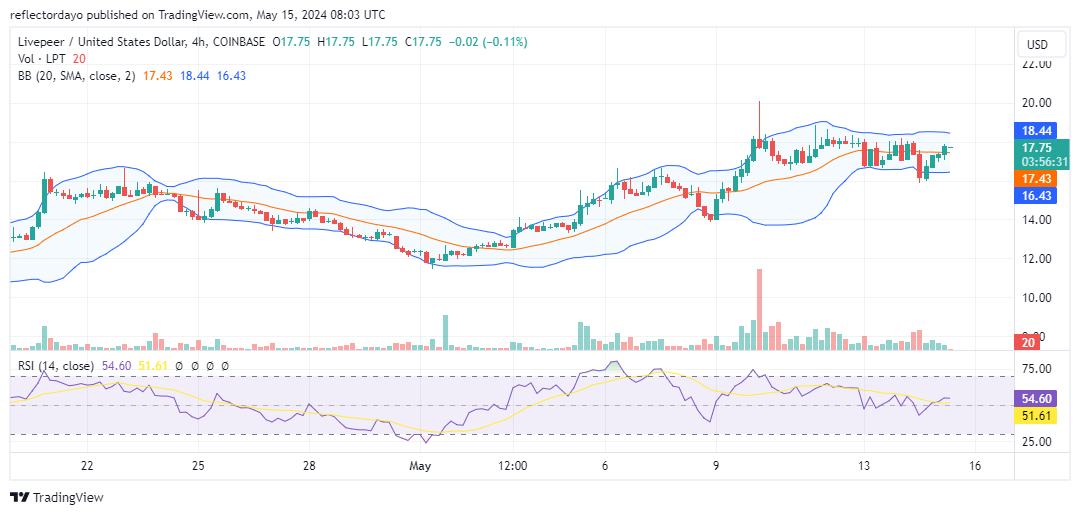
LPT/USD Price Prediction: 4-Hour Chart Analysis
From a 4-hour chart perspective, the $17.45 price level has emerged as a notable support level, attracting considerable buying activity from traders. However, a semblance of tug-of-war is evident, with bears consolidating their position around the $18.00 price mark, presenting a formidable resistance level. Nevertheless, the candlestick pattern observed in the current session suggests a prevailing bullish sentiment, despite the bears’ establishment above the $17.75 price level. Analysts and traders should remain vigilant for signs of a volatility squeeze, as it could indicate the potential onset of bullish momentum.


