Chainlink (LINK/USDT) Suspends at a Crucial Inflection Point
Estimated Reading Time: 3 minutes
Don’t invest unless you’re prepared to lose all the money you invest. This is a high-risk investment and you are unlikely to be protected if something goes wrong. Take 2 minutes to learn more

Chainlink Long-term Analysis: Ranging
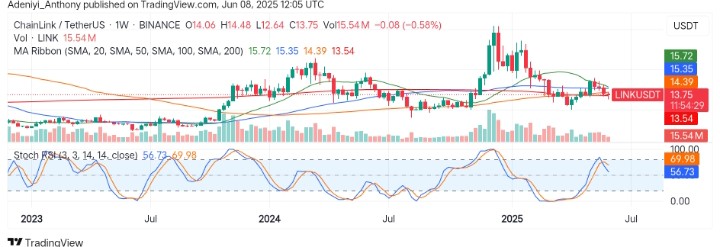
The market for Chainlink against the Tether has shown a consolidation within a broader upside movement that began some months ago. However, the weekly chart below captures a bullish breakout above $13.00 in 2024 before observing a correction. Now the pair appears to be ranging within the cluster of the moving average ribbon.
As it stands, the momentum is stalled, and the price is compressing within a tight space, signaling a volatile move is brewing. However, the direction of the Stochastic RSI suggests upcoming movement might favor the bears. Until then, the impending movement remains indecisive.
Currently, Chainlink trades at $13.75 after recording more than 15.50 million traded volumes for the week.
Technical Indicators
Major Resistance Levels: $14.39, $15.20, and $15.72
Major Support Levels: $13.54, $12.00, and $10.40
Chainlink Technical Analysis
The analysis of Chainlink against the Tether on the weekly timeframe shows the pair is in a consolidation phase. However, the price is compressing between the 20, 50, 100, and 200 SMAs, suggesting an impending breakout or breakdown might surface soon.
From another angle, the Stochastic has displayed a bearish crossover within the bullish circumference, signaling an early sign of momentum fading as volume declines further.
To this end, the pair has seen a rejection around the $14.00 level, but a further dip below $13.54 would indicate bearish dominance. Conversely, if the bulls can take the opportunity of the dip, a breakout above $14.39 would change the course of things.
LINK/USDT Analysis: What Happens Next?
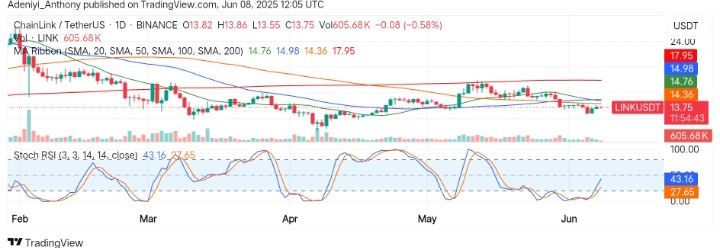
On the daily timeframe, LINK/USDT appears to be operating under the moving average ribbon as the price goes as far as $13.55. However, from another angle, the oscillator suggests hope ahead as the lines appear to be curling to the north from the oversold region despite a slight fall in the volume.
To this end, a move above $14.36 in the near term would indicate a breakout; otherwise, a further fall in price would point to the formation of lower lows.
You can purchase crypto coins here. Buy LBlock