Chainlink (LINK/USDT) Eyes Bullish Breakout as Momentum Builds Above $13.63
Estimated Reading Time: 3 minutes
Don’t invest unless you’re prepared to lose all the money you invest. This is a high-risk investment and you are unlikely to be protected if something goes wrong. Take 2 minutes to learn more

Chainlink Long-term Analysis: Bullish
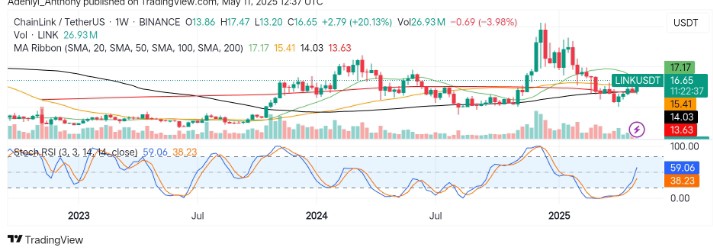
The market for Chainlink against the Tether has undergone a significant correction since its late 2024 November high. However, the pair appears to be rebounding from a key long-term simple moving average, moving to the north after a breakout from a prolonged consolidation phase.
Recently, the pair has bounced strongly above the immediate close, gaining over 20% and pushing through multiple moving averages. However, the current spike in volume and the bullish crossover on the Stochastic RSI suggest more upside movement if momentum holds.
Currently, Chainlink trades at $16.65, recording over 26 million traded volumes for the week.
Technical Indicators
Major Resistance Levels: $17.17, $20.00, and $23.00
Major Support Levels: $15.41, $14.03, and $13.63
Chainlink Technical Analysis
The analysis of Chainlink against the Tether on the weekly chart shows that the price is just reclaiming vital long-term moving averages after weeks of prolonged range-bound activities, displaying a strong bullish sign as the price targets the $17.17 resistance level.
From another angle, the Stochastic oscillator suggests continued upward movement as the lines of the indicator point to the north with a bullish crossover, indicating a strong bullish movement. However, the 3.98% drop in the traded volume indicates that bullish momentum is gradually waning, signaling the pair might experience a slight pullback in the near term if bullish momentum fails to hold.
To this end, a break above $17.17 with sustained strength could propel the pair’s value towards the 23.00 level; otherwise, a break below the current level with declining volume might lead to the retest of previous support levels.
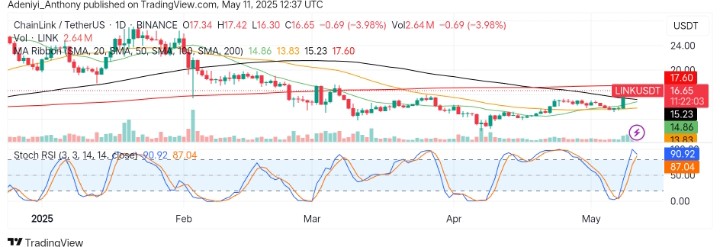
LINK/USDT Analysis: What is Happening?
On the daily timeframe, LINK/USDT appears to have shown renewed bullish activity, breaking above the recent consolidation area as volume increases. As it stands, current price action suggest the price seems to be struggling to break above the 100 SMA after moving rapidly above the 20 and 50 period lines.
The Stochastic oscillator, on the other hand, suggests the pair’s momentum is beginning to drop as the blue line starts to curl to the south, indicating a short-term cool-off before further bullish continuation as volume drops. To this end, a move towards $23.00 is still possible, provided the current pullback does not break below $15.58 before bullish strength is rekindled.
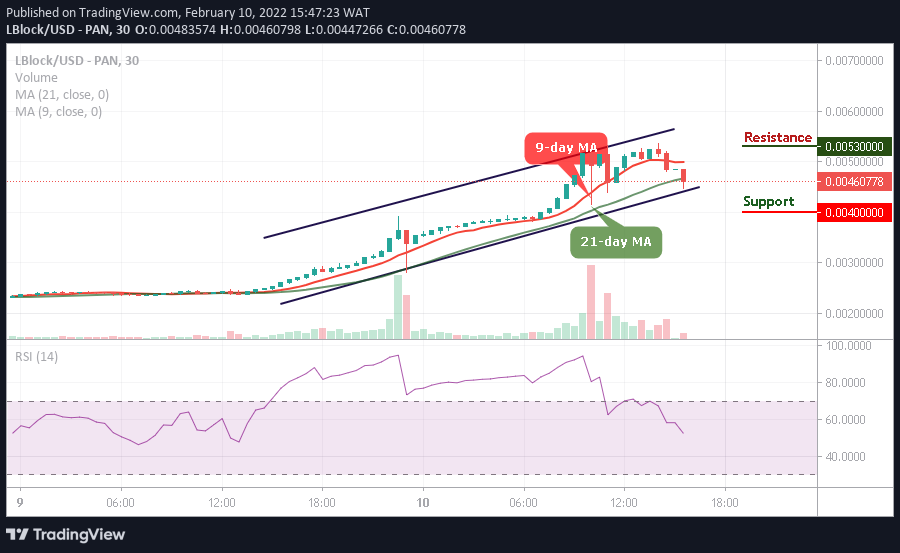
You can purchase crypto coins here. Buy LBlock