Chainlink (LINK/USDT) Attempts Recovery as Bulls Stir Near Critical Demand Zone
Estimated Reading Time: 3 minutes
Don’t invest unless you’re prepared to lose all the money you invest. This is a high-risk investment and you are unlikely to be protected if something goes wrong. Take 2 minutes to learn more

Chainlink Long-term Analysis: Ranging
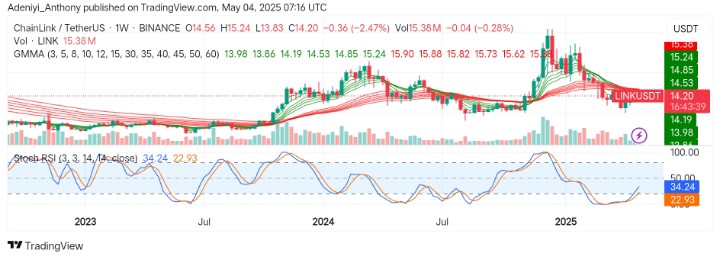
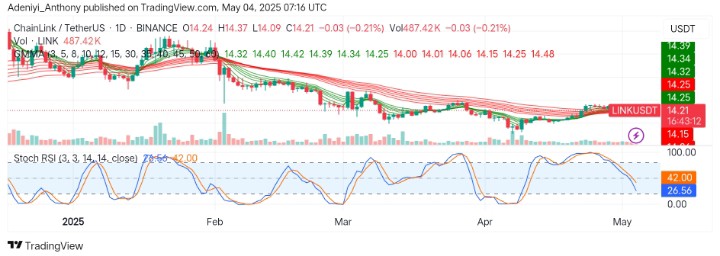
Chainlink against the Tether, one of the strong-performing pairs in the previous years, has shown signs of exhaustion after a multi-month downtrend. However, the Stochastic RSI beneath the chart is beginning to curl upside from oversold levels, suggesting a renewed but early bullish interest.
Recently, the price has been hovering near a critical and historical $14.00 level where a reversal setup is beginning to form. To this end, more confirmation is needed to see if the pair would break above $14.85 or break below $14.00 in the near term.
Currently, Chainlink trades at $14.20, recording 15.38 million traded volumes with a loss of over 2% for the week.
Technical Indicators
Major Resistance Levels: $15.90, $17.20, and $19.00
Major Support Levels: $14.00, $13.00, and $12.00
Chainlink Technical Analysis
The analysis of Chainlink against Tether on the weekly chart shows that the pair has been moving without a clear trend for a while. However, the Guppy Multiple Moving Averages (GMMAs) signal the pair is bearish with possible accumulation below the ribbon, suggesting an early reversal move.
On the other hand, the Stochastic oscillator is starting to move to the north from the oversold zones as the volume begins to stabilize.
To this end, a move above $14.85 could lead to the actualization of the $15.90 target; otherwise, the range-bound movement, or a decline, might surface.
LINK/USDT Analysis: What’s Next?
On the daily timeframe, LINK/USDT seems to be stabilizing above the $14.00 level with a slight bullish tilt with the price wrapped tightly around the GMMAs. This move suggests a squeeze before a potential expansion as the volume remains low but steady, indicating accumulation rather than panic selling.
From another angle, the oscillator appears to be pulling back from a recent high, delving into the oversold region. However, if the bulls can hold above the $14.00 support, a quick momentum shift may be recorded towards $14.50 provided the oscillator signals a bullish crossover at this point.
You can purchase crypto coins here. Buy LBlock