Chainlink (LINK/USDT) Signals Reversal as Bulls Eyes $18.00 Resistance Level
Estimated Reading Time: 3 minutes
Don’t invest unless you’re prepared to lose all the money you invest. This is a high-risk investment and you are unlikely to be protected if something goes wrong. Take 2 minutes to learn more

Chainlink Long-term Analysis: Bullish
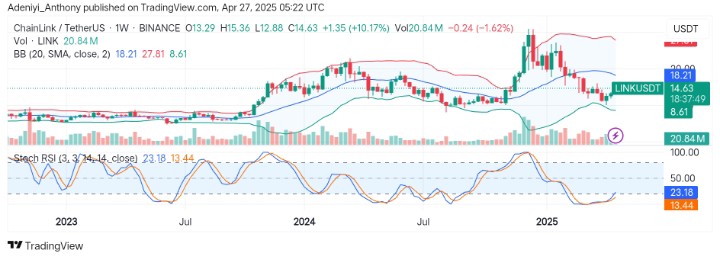
Recently, Chainlink against the Tether has shown signs of a potential trend reversal after weeks of downward pressure. However, the pair’s bold move above the $13.00 support level shows that LINK/USDT has rebounded sharply, gaining over 10% from its previous opening.
As it stands, technical indicators suggest that bullish momentum could be rebuilding as the Stochastic RSI curls upwards from an extremely oversold region. However, caution is needed; meanwhile, the price actions towards the $18.00 level around the mid-Bollinger band signal a movement targeted in that direction is underway.
Currently, Chainlink trades at $14.63, recording 20.84 million traded volumes for the week.
Technical Indicators
Major Resistance Levels: $18.21, $21.00, and $27.81
Major Support Levels: $13.00, $10.50, and $8.60
Chainlink Technical Analysis
On the weekly chart, Chainlink against the Tether is signaling a potential bullish reversal as the pair sees an improvement to the north. However, the pair appears to be aiming at the $18.21 mid-band level as momentum builds.
From another angle, the Stochastic oscillator shows the pair is carefully making its way back to the north after what seems to be a prolonged consolidation phase. To this end, Chainlink must break above $18.21 for a confirmed reversal toward the $20.00 level; otherwise, the pair might retest the $10.50 support level.
LINK/USDT Analysis: What’s Next?
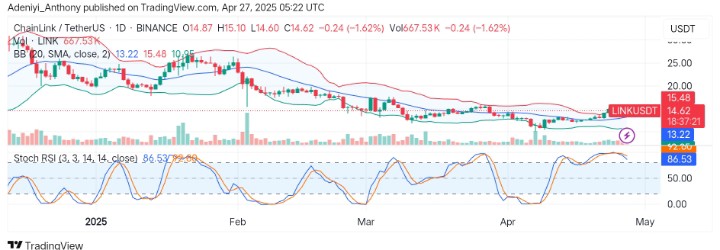
On the daily timeframe, LINK/USDT seems to be consolidating above the 20-period dynamic level, pointing to ongoing buying pressure. However, the Stochastic RSI remains elevated near the overbought zone, indicating a strong momentum despite indicated pullbacks.
As it stands, $15.48 is the next hurdle to break for the bulls as trading volumes increase to support upward movement. To this end, a continuation of movement towards $18.00 would be possible if the $15.48 level is broken; otherwise, a retracement would be recorded.
You can purchase crypto coins here. Buy LBlock