POL (prev. MATIC) Price Prediction: POL/USDT Stays Southwards
Estimated Reading Time: 3 minutes
Don’t invest unless you’re prepared to lose all the money you invest. This is a high-risk investment and you are unlikely to be protected if something goes wrong. Take 2 minutes to learn more

Date: November 1, 2025
The Polygon token has continued to edge lower. Although the downward retracement has been slow and steady, the current state of the market continues to suggest a bearish future direction.
POL/USDT Long-Term Trend — Bearish (Daily Chart)
Key Price Levels:
Resistance: $0.1900, $0.2150, $0.2450
Support: $0.1800, $0.1750, $0.1500
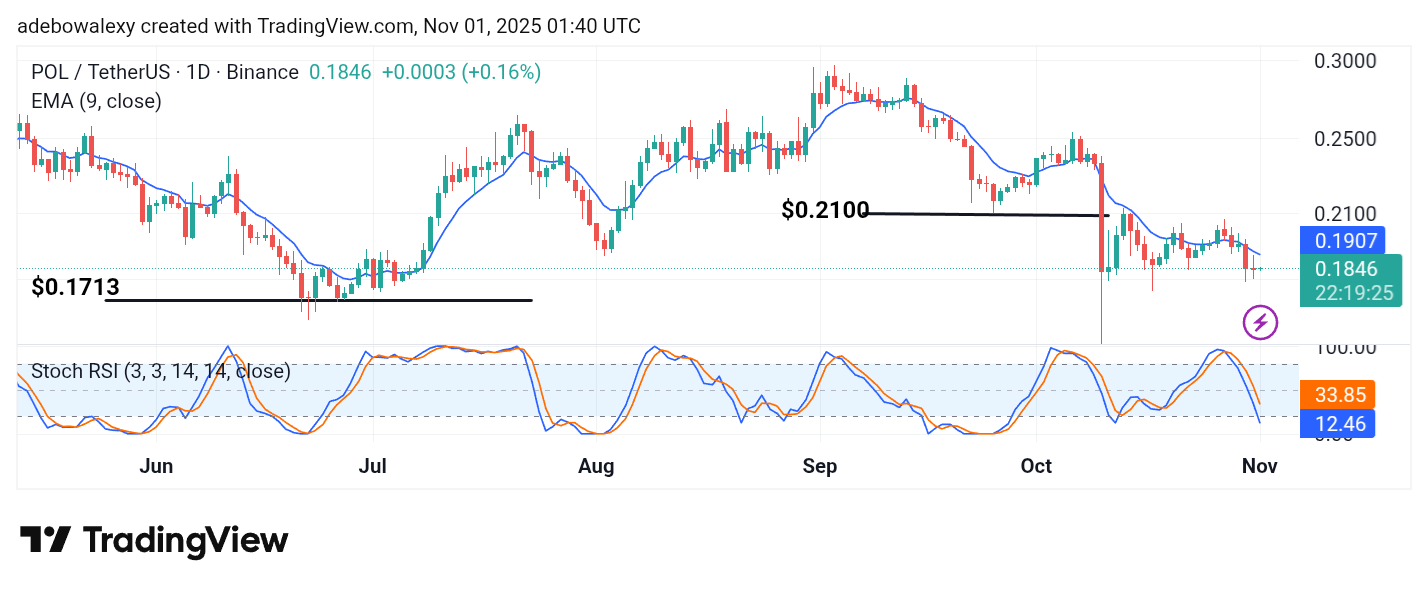
The POL (prev. MATIC) token has started the new month on a bearish note. Price action continues to appear below the 9-day Exponential Moving Average (EMA) line. In addition, the price candle corresponding to the current session is a spinning top. It is a green one, but its size suggests very minimal price changes. The lines of the Stochastic Relative Strength Index (SRSI) indicator, however, have continued to move southward and into the oversold region, even at a time when price action has barely moved for two sessions.
POL/USDT Price Prediction: POL (prev. MATIC) Eyes the Next Long-Term Support
Although price activity in the POL (prev. MATIC) market seems to have assumed a stagnant stance, technical indications suggest that downward forces are still very much in control. From the previous session to the current one, trading has ended on a flat note.
The current session is represented by a green price candle but shows very little movement. In addition, price action remains below the 9-day EMA curve. The applied Stochastic Relative Strength Index (SRSI) indicator lines also maintain a straight bearish path as they move into the oversold zone. Therefore, this market seems headed for the next support level.
POL/USDT Price Prediction: POL (prev. MATIC) Bearish Outlook Stays Dominant (4-Hour Chart)
The POL (prev. MATIC) market has maintained its position below important technical levels. The last price candle stands below the 9-day EMA curve. Similarly to observations on the daily chart, it is green but shows only minimal gains.
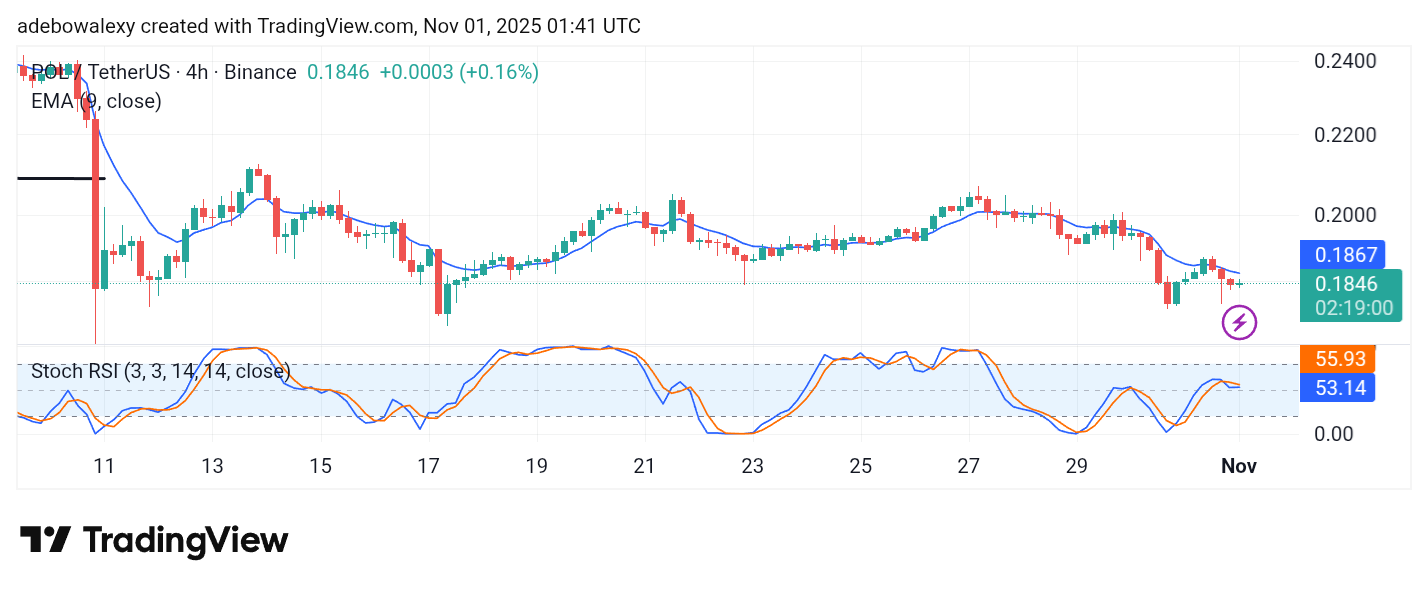
The SRSI indicator line here also takes on a generally downward trajectory. However, the terminal part of the SRSI shows a slight sideways movement, suggesting a short-term indecision among participants in the ongoing session. Nevertheless, this market still appears predisposed to testing the $0.1800 price level soon.