Lucky Block (LBLOCK/USD) Market Primes for Bullish Surge as Price Eyes Key Resistance Levels
Estimated Reading Time: 3 minutes
Don’t invest unless you’re prepared to lose all the money you invest. This is a high-risk investment and you are unlikely to be protected if something goes wrong. Take 2 minutes to learn more

Lucky Block Price Forecast – August 20
The LBLOCK/USD market primes for a bullish surge as price eyes key resistance levels. Following a complete retracement into the bullish order block, the rally is likely to resume.
The pair shows bullish potential based on key indicators. The Stochastic Oscillator is currently at 60.50, nearing overbought territory, which indicates increasing buying pressure. The Simple Moving Average (SMA) with a 9-day period is positioned below the current price level at $0.00001786, reflecting a positive momentum shift in the short term.
LBLOCK/USD Market Key Levels:
Resistance levels: $0.00002440, $0.00003290, $0.00003940
Support levels: $0.00001400, $0.00001160, $0.00000930
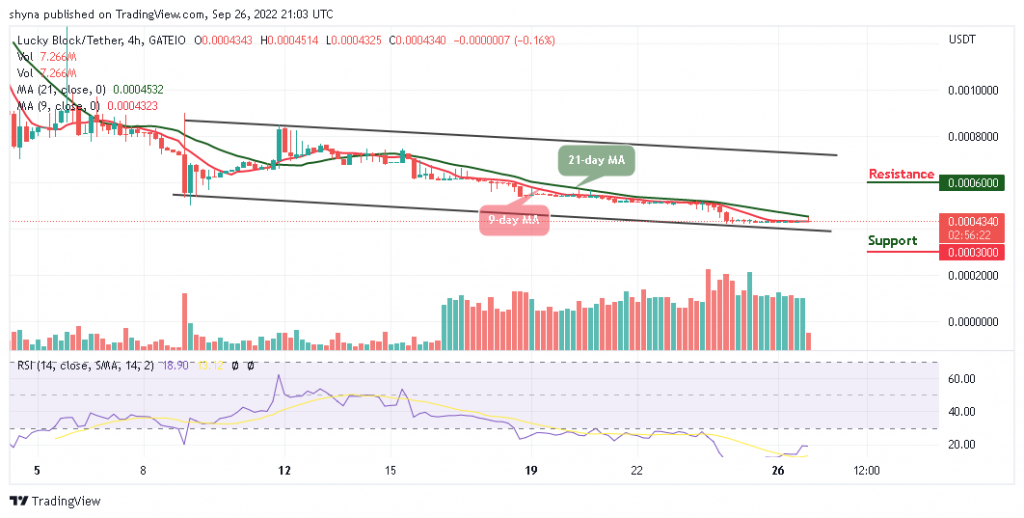
LBLOCK/USD – Daily Chart
The daily chart for LBLOCK/USD shows that the market is heading towards key resistance levels.
LBLOCK/USDT recently bounced from a strong support zone around $0.00001400 to $0.00001760, showing upward strength. The pair has been consolidating within a range, but recent bullish candlesticks suggest a breakout toward $0.00002440, a key resistance level. The price has also retraced to the 0.618 Fibonacci level of $0.00001770, further confirming the bullish momentum.

What is expected of LBLOCK/USD in the coming days?
Looking ahead, the projection for LBLOCK/USDT indicates continued upward movement. If the price can hold above the bullish order block.
A successful breakout above this level may drive the price towards $0.00003290 or even $0.00003940 in the longer term. However, if a pullback occurs, the key support to watch is around $0.00001400.

LBLOCK/USD – Four-Hour Chart
The LBLOCK/USDT pair is showing bullish momentum on the four-hour chart, as it recently bounced from support at $0.00001400 and is now trading above the 9-period SMA at $0.00001730. The Stochastic RSI is approaching overbought territory, indicating possible short-term consolidation on the four-hour chart.
The price action has maintained higher lows, supported by a trendline, suggesting sustained buying interest. Key resistance at $0.00002440 could be tested soon, with a potential breakout leading to $0.00003290.
Lucky Block (LBLOCK) Current Statistics
The current price: $0.00001970
Market Capitalization: $1,440,000
Trading Volume: $1,770
Do you need a coin that will 100X soon? Get LBLOCK here