Compound (COMP/USD) Approaches $60 Amid Cautious Optimism
Estimated Reading Time: 3 minutes
Don’t invest unless you’re prepared to lose all the money you invest. This is a high-risk investment and you are unlikely to be protected if something goes wrong. Take 2 minutes to learn more
The Compound market has experienced a notable increase in trading volume over the past few days, culminating in a decisive breakout during yesterday’s trading session. Previously, COMP had been consolidating around the $40 price level, with fluctuating buying and selling pressure failing to establish a clear trend.
However, the recent breakout suggests growing bullish momentum, though lingering market volatility has tempered the rally, keeping traders cautious as COMP approaches the $60 resistance level. The sustainability of this upward move will depend on whether buying interest persists or if profit-taking triggers a pullback.
Compound Market Data
- COMP/USD Price Now: $54.58
- COMP/USD Market Cap: $494.9 million
- COMP/USD Circulating Supply: 9.08 million COMP
- COMP/USD Total Supply: 10 million COMP
- COMP/USD CoinMarketCap Ranking: #117
Key Levels
- Resistance: $60, $65, and $70
- Support: $50, $45, and $40
Compound (COMP/USD)—Indicator Analysis Reveals Bullish Breakout Amid Volatility
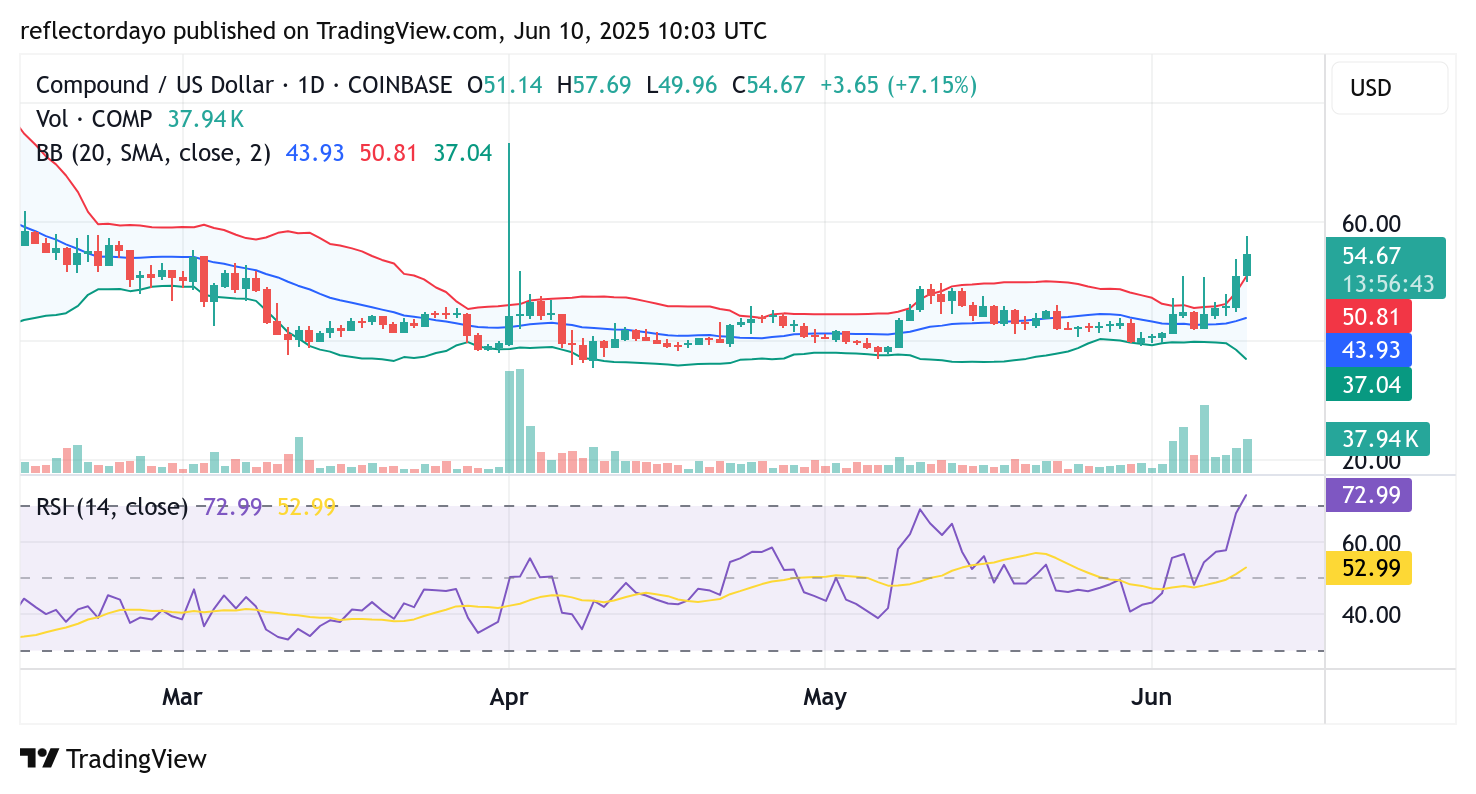
From a technical perspective, the daily chart shows that while Compound has broken out of consolidation, volatility remains elevated—a trend observed over recent days as investor interest intensified on both the demand and supply sides. Although bulls currently dominate, the market remains highly volatile, posing challenges for a sustained push toward the $60 resistance level.
The RSI has entered overbought territory, signaling strong upward crypto market momentum. However, the presence of upper wicks on recent candlesticks suggests potential profit-taking and a near-term pullback. If a correction occurs, holding above the $50 support level will be crucial to maintaining the bullish trajectory.
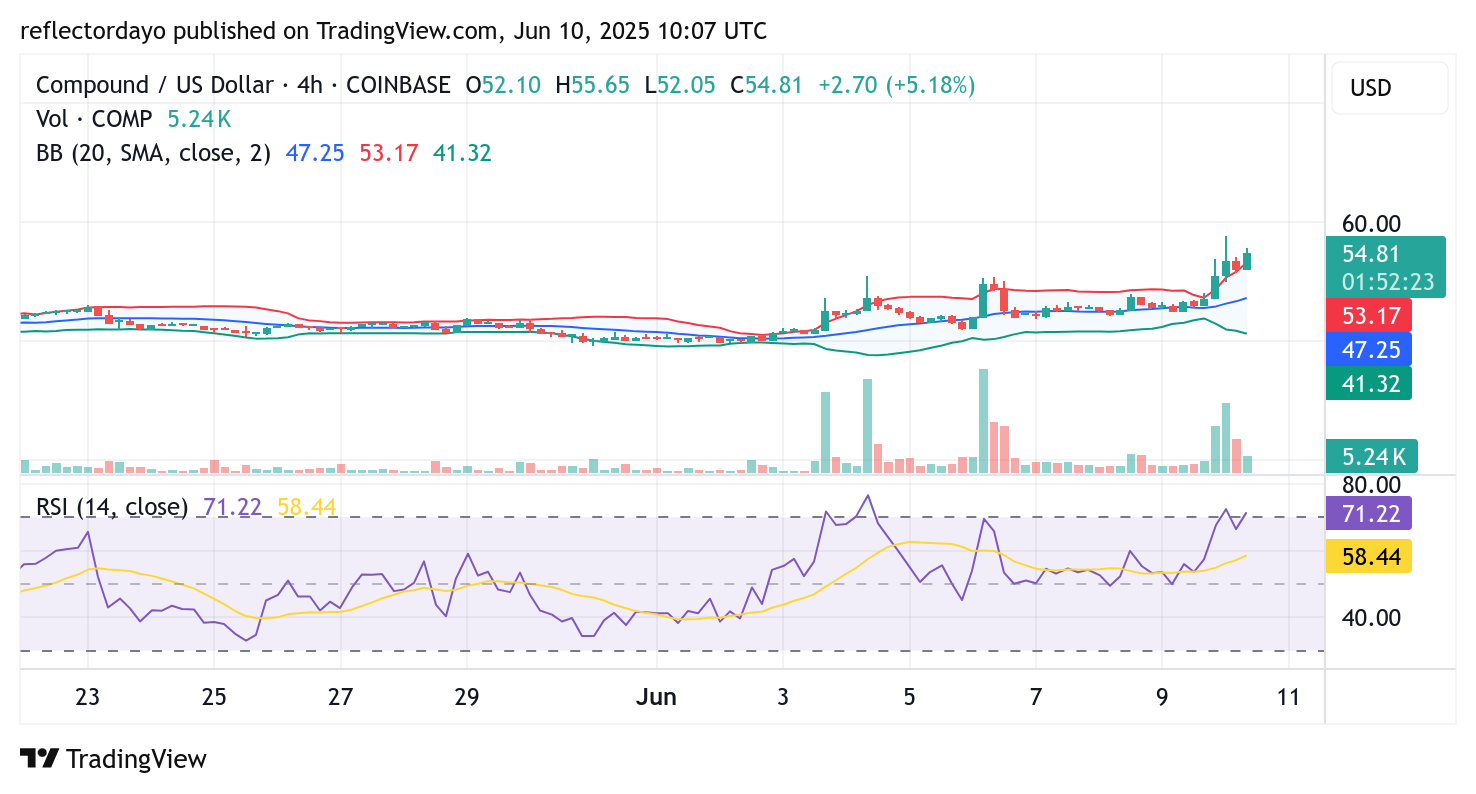
COMP/USD 4-Hour Chart: Overbought Conditions Give Way to Consolidation Near Key Support
The 4-hour chart reveals that while the market remains in overbought territory, signs of consolidation are emerging. Bulls appear to have established a stronger support level near $51, gradually absorbing selling pressure. This shift is further supported by the shortening histogram bars indicating weakening momentum and a potential period of range-bound trading.
Should this consolidation hold, it may allow the market to stabilize before determining its next directional move. Traders should monitor whether $51 sustains as support, as a breakdown could signal a deeper correction, while holding this level may reinforce bullish continuation.