Jito (JTO/USD) Remains Under Pressure as Bulls Struggle to Regain Control
Estimated Reading Time: 4 minutes
Don’t invest unless you’re prepared to lose all the money you invest. This is a high-risk investment and you are unlikely to be protected if something goes wrong. Take 2 minutes to learn more

The Jito (JTO/USD) market continues to face significant bearish pressure, with the broader downtrend that began in December 2024 still weighing heavily on sentiment. Despite intermittent attempts by the bulls to initiate a recovery, momentum remains weak and largely confined within a narrow consolidation range.
The sustained decline, which started around the $4.30 price level on December 11, 2024, appears to have found temporary support near the $1.50 zone. However, the market has yet to establish a convincing bullish reversal. Since bottoming out, price action has struggled to reclaim and hold above the key psychological resistance at $2.00.
This prolonged consolidation and the bulls’ inability to stage a sustained breakout indicate that the market is still in a transitional phase. In the following sections, we will take a closer look at technical indicators and price behavior to assess whether a meaningful shift in trend may be on the horizon.
Jito Market Data
- JTO/USD Price Now: $1.79
- JTO/USD Market Cap: $609 million
- JTO/USD Circulating Supply: 336 million JTO
- JtO/USD Total Supply: 999 million JTO
- JTO/USD CoinMarketCap Ranking: #100
Key Levels
- Resistance: $2.00, $2.50, and $3.00
- Support: $1.50, $1.00 and $0.90
Jito (JTO/USD): Indicators Signal Weak Recovery Amid Consolidation
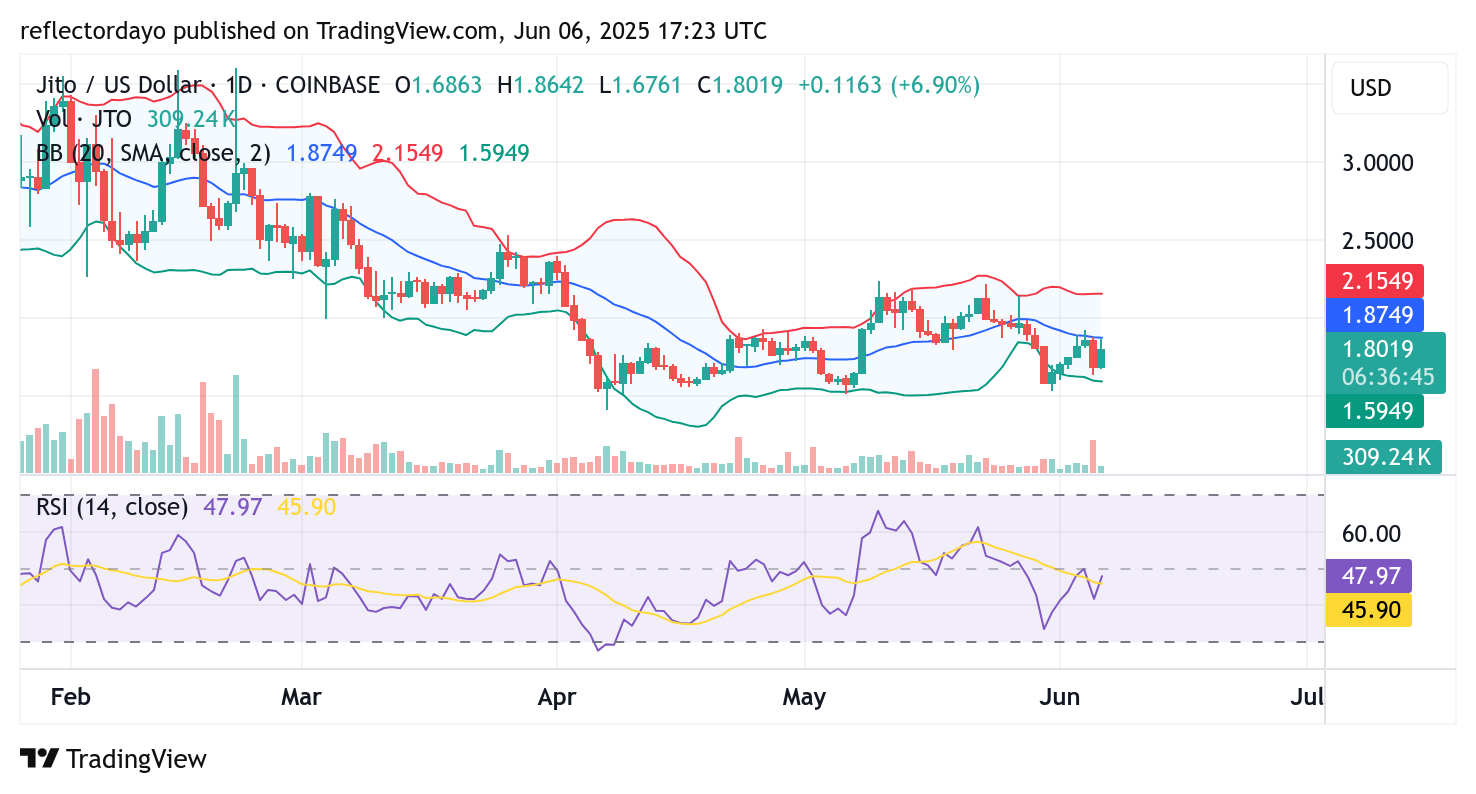
From a technical standpoint, there are signs that the bearish momentum in the Jito (JTO/USD) market may be losing strength. Since finding solid support around the $1.50 level in early April, the market has shown signs of attempting a bullish reversal. However, the recovery has so far lacked the strength needed to drive sustained upward movement.
According to the Bollinger Bands indicator, JTO is currently consolidating within a defined price range, bounded by the $1.50 support and the $2.00 resistance levels. While price action has tested the $2.00 threshold multiple times, each attempt has failed to establish a firm breakout above that level.
There are, however, a few encouraging signs. The formation of slightly higher lows—most recently around $1.70—suggests a modest shift in momentum toward the bulls. Yet, until the price decisively breaks above the $2.00 barrier, market sentiment is likely to remain cautious.
All eyes are now on the $2.20 resistance level. A breakout above this point could trigger increased buying interest and potentially ignite a more substantial bullish recovery of the crypto signal.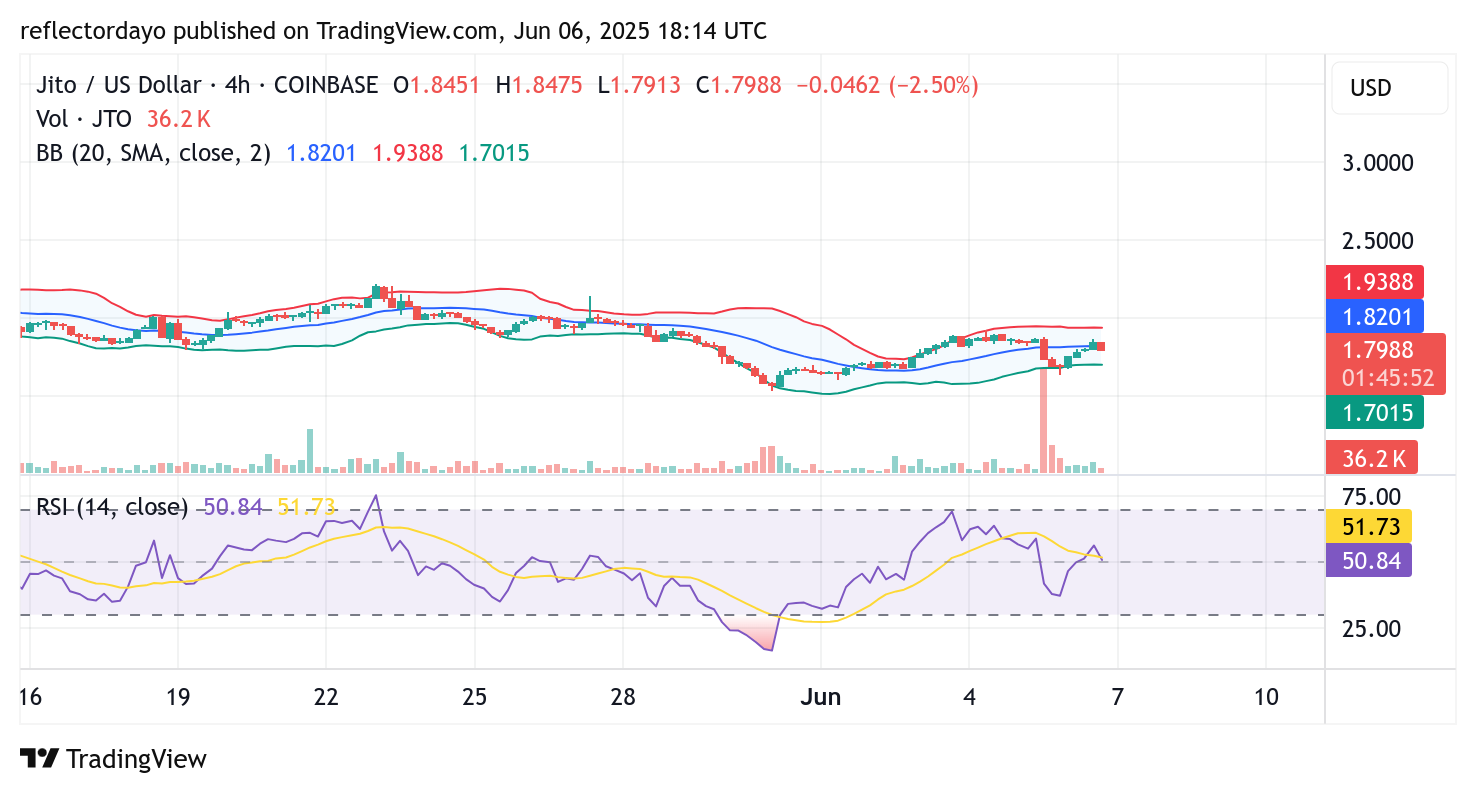
JTO/USD 4-Hour Chart: Price Stabilizes at Key Level as Market Eyes Breakout
The JTO/USD pair is currently displaying a mildly bullish structure on the 4-hour chart, supported by steady monthly gains and a noticeable uptick in trading volume in recent sessions. While momentum appears to lean toward the upside, technical indicators urge a cautious approach.
At present, the price is holding around the $1.80 level—an area that the Relative Strength Index (RSI) identifies as the current equilibrium. This suggests a temporary balance between buying and selling pressure.
Traders are closely monitoring this level, as a decisive move from here could set the tone for the next directional push. A sustained break above this zone may signal a bullish continuation, while a drop below could invite renewed bearish pressure.