Litecoin (LTC/USD) Trade Rebounds, Averaging $150
Estimated Reading Time: 3 minutes
Don’t invest unless you’re prepared to lose all the money you invest. This is a high-risk investment and you are unlikely to be protected if something goes wrong. Take 2 minutes to learn more

Free Crypto Signals Channel
Litecoin Price Prediction – February 8
It has now been that the LTC/USD market operations take to a positive northward step as the crypto-economic trade rebounds, averaging $150 resistance. Price is trading around $137, having witnessed a high and a low of $142 and $135 at a minute o.12 percentage rate.
LTC/USD Market
Key Levels:
Resistance levels: $150, $160, $170
Support levels: $110, $100, $90
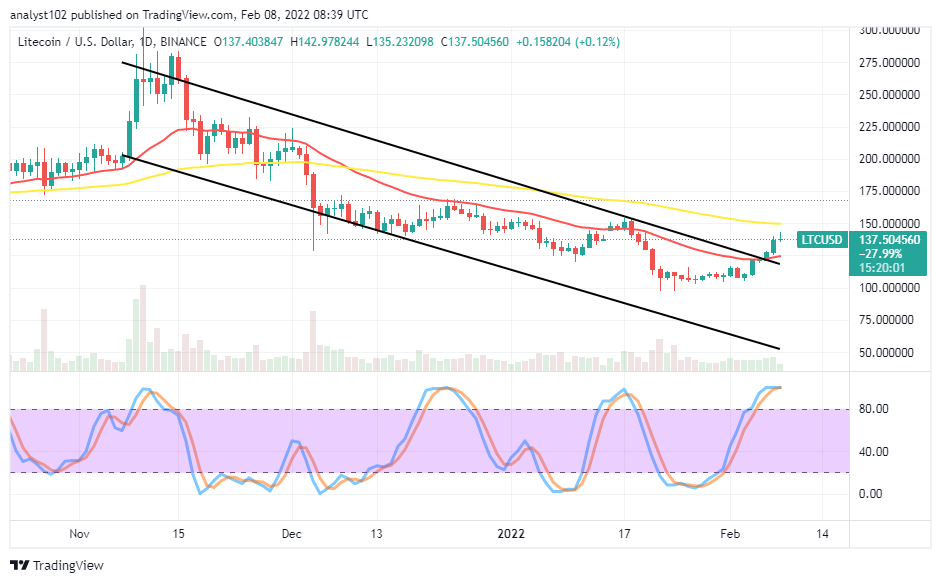
LTC/USD – Daily Chart
The LTC/USD daily chart showcases the crypto-economic trade rebounds against the trend line of the smaller SMA, averaging $150 resistance. The 14-day SMA indicator is underneath the 50-day SMA indicator. The upper bearish trend line drew southward across the SMAs. The Stochastic Oscillators are in the overbought region. The crypto economy tends to lose stances to a downward trending motion.
Will there be more upsurges in the LTC/USD price as the crypto trade rebounds, averaging $150 resistance?
There may be more upward surges in the LTC/USD market operations if the price holds firm for a long time over the value of $125 psychological level as the crypto-economic trade rebounds, averaging $150 resistance. However, the following upward pushing may not be coming sustainably to surpass the value-line mentioned earlier. Even at this point, the launching of long position orders should suspend for a while to avoid unnecessary bulls’ traps.
On the downside of the technical analysis, shorting of order positions may soon take to its course of operations beneath or around the $150 expectedly. A re-emergence of a bearish candlestick confirmation needed to occur at a higher trading spot around the $150 level before considering a re-launch of the sell order. With the current upside-pushing pace of the crypto economy, the price is on a high expectation to begin to downsize in the near session.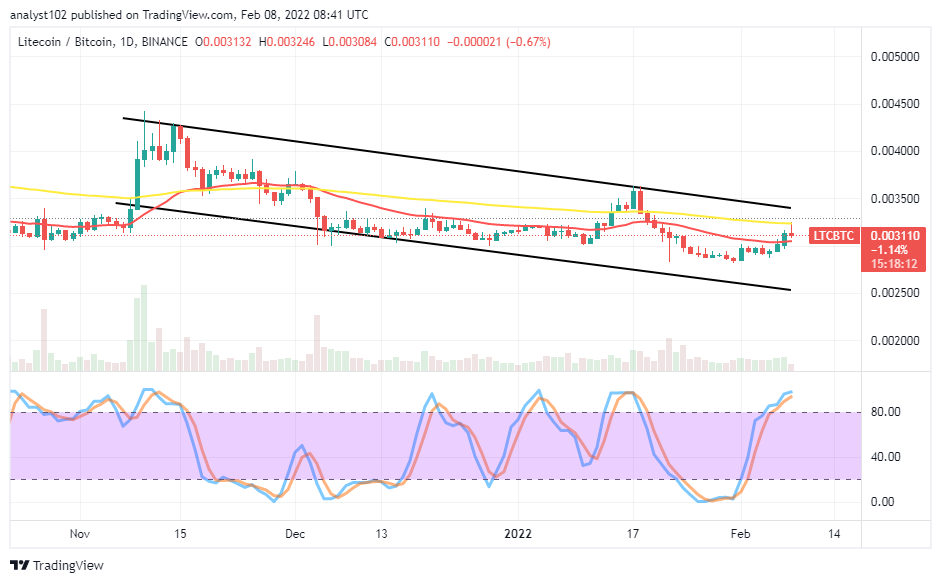
LTC/BTC Price Analysis
In comparison, the trending capacity of Litecoin features struggling to push against Bitcoin on the price analysis chart. The cryptocurrency pair trade rebounds, averaging the trend line of the bigger SMA. The 50-day SMA indicator is above the 14-day SMA indicator. The Stochastic Oscillators are in the overbought region, seemingly attempting to conjoin their lines against the northbound moving direction within. A candlestick in the making shows a slight reversal of an upward force to indicate the potentiality of the base crypto losing a stance to the flagship counter crypto in no time.
Note: Cryptosignals.org is not a financial advisor. Do your research before investing your funds in any financial asset or presented product or event. We are not responsible for your investing results.
You can purchase crypto coins here. Buy Tokens