POL (prev. MATIC) Price Prediction: POL/USDT Modest Recovery Stays Subdued
Estimated Reading Time: 3 minutes
Don’t invest unless you’re prepared to lose all the money you invest. This is a high-risk investment and you are unlikely to be protected if something goes wrong. Take 2 minutes to learn more

Date: September 27, 2025
Following the recent huge crash in the crypto market, some of the coins have started a recuperating journey. Among such coins is the POL (prev. MATIC) coin. Although the registered gains in this market are still below key limits, let’s take a much closer look at the market.
POL/USDT Long-Term Trend — Bullish (Daily Chart)
Key Price Levels:
Resistance: $0.2500, $0.2750, $0.3000
Support: $0.2000, $0.1750, $0.1500
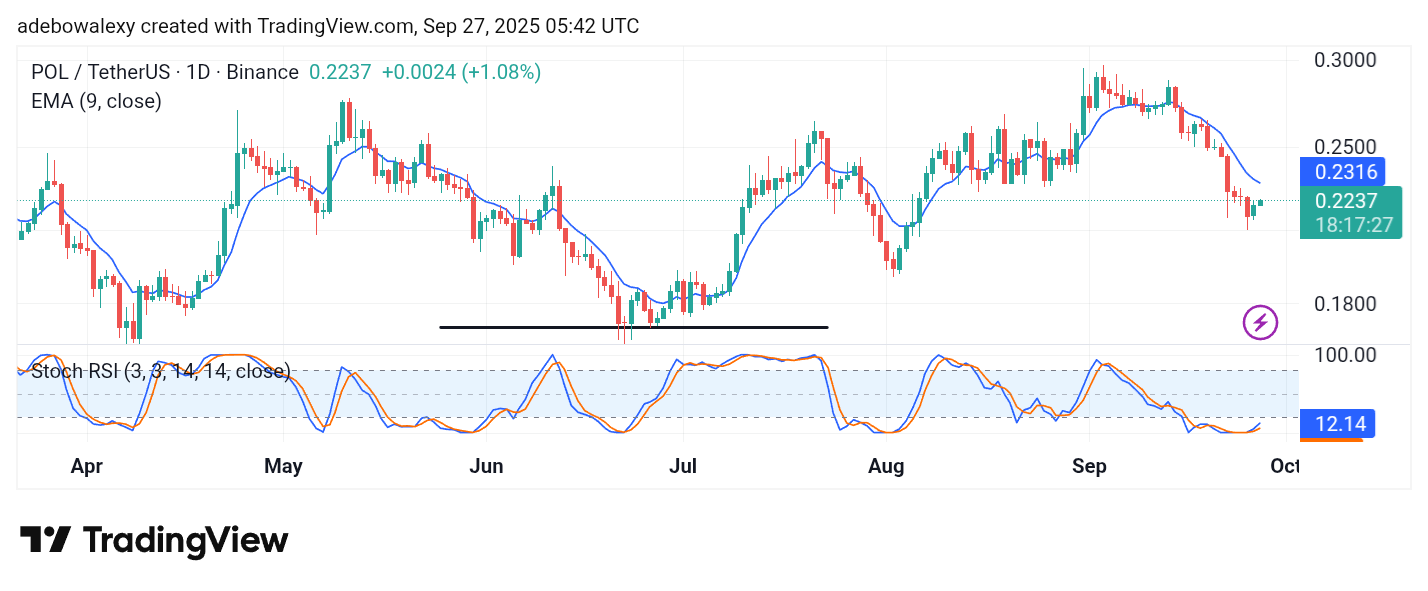
The POL (prev. MATIC) market has registered modest gains for two sessions in a row. Yet the corresponding price candles lie below the 9-day Exponential Moving Average (EMA) line. Meanwhile, the lines of the Stochastic Relative Strength Index are responding to the recent gains in the market, as the lines of the indicator can be seen rising steadily upward from the oversold region of the indicator following an upward crossover there.
POL/USDT Price Prediction: POL (prev. MATIC) Minimal Gains May Develop Further
The POL (prev. MATIC) market is surely on a recovery path. However, price movement needs to pass some technical tests before traders can start taking a more serious bullish stance in this market. The last price candle on the chart stays green and bald, nevertheless keeps edging higher.
Albeit it keeps trading activity below the 9-day EMA curve. Meanwhile, the lines of the SRSI indicator can be seen responding to the latest upside retracement in this market. The lines of this indicator seem to be rising fairly just yet and, as such, hint that there might still be short-term opportunities in this market even with a potential ceiling ahead at the 9-day EMA line.
POL/USDT Price Prediction: POL (prev. MATIC) Buyers Are Taking a Steady Approach to the Market (4-Hour Chart)
Coming to the 4-hour price chart, it can be seen that price action has stayed straight bullish over the past four sessions till now. Consequently, trading activity has surpassed the 9-day EMA line on this chart. The last three price candles on this chart appear almost of the same size but keep rising higher.
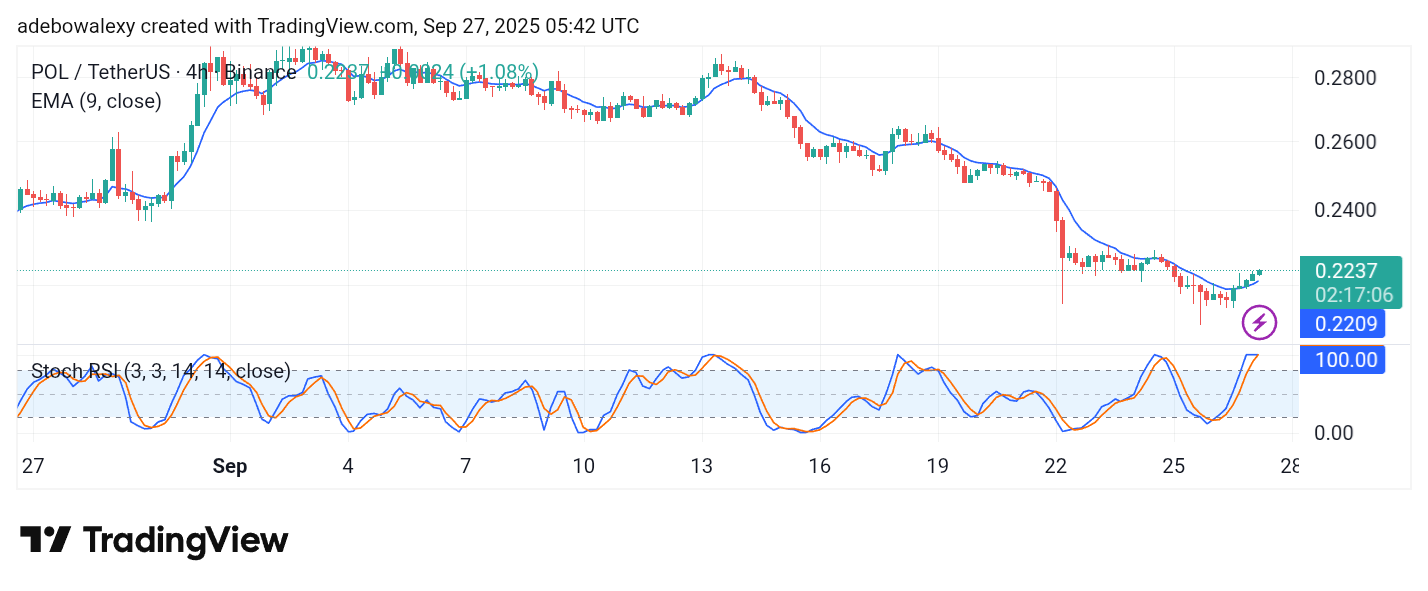
Meanwhile, the lines of the SRSI have reached the 100 mark of the indicator. Also, the lines of this indicator can be seen merged there and may likely drag there before a pullback. A drag in this region may afford price movement to at least hit the $0.2300 price level before a pullback, leaving the door open for short-term gains.