Polygon (ex-MATIC) Price Prediction: POL/USDT May See a Bullish Breakout
Estimated Reading Time: 3 minutes
Don’t invest unless you’re prepared to lose all the money you invest. This is a high-risk investment and you are unlikely to be protected if something goes wrong. Take 2 minutes to learn more

Polygon (ex-MATIC) Price Prediction: October 12
While price activity is consolidating around the $0.3720 threshold, the market seems to be trading in a pattern that suggests a potential bullish breakout. Technically, this indicates that the market may experience an upside move, possibly pushing through the immediate resistance level.
POL/USDT Long-term Trend: Bullish (Daily Chart)
Key Price Levels:
Resistance: $0.4000, $0.4500, $0.5000
Support: $0.3500, $0.3000, $0.2500
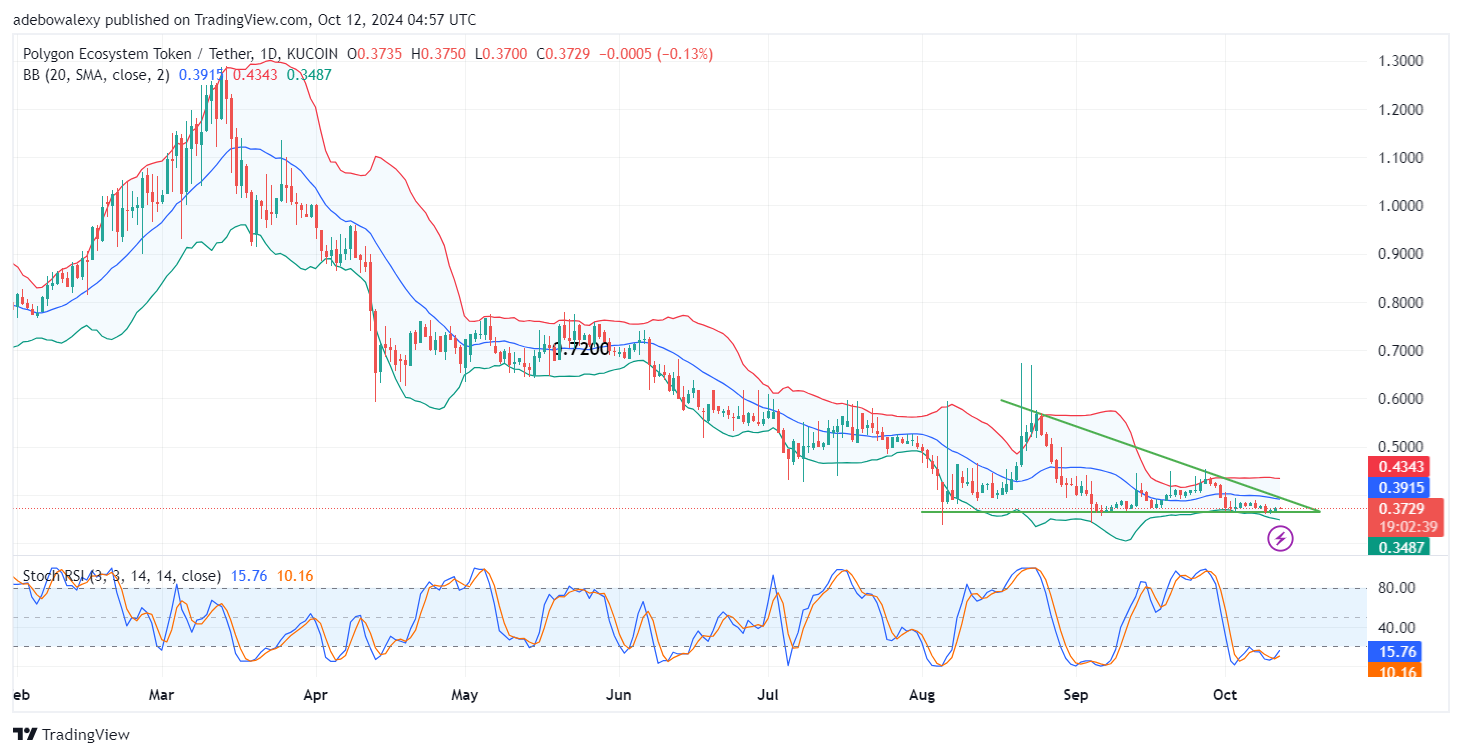
Recent price candles indicate low volatility in this market, largely due to low participation. However, price action over the past two sessions has shown an upside rebound off the floor of the falling wedge structure drawn on the chart. Despite this, trading activity remains below the middle limit of the Bollinger Bands, with the last price candle showing a slight downward retracement. The Stochastic Relative Strength Index (Stochastic RSI) has formed a bullish crossover, and the lines move upward following that signal.
Polygon (ex-MATIC) Price Prediction: POL/USDT Market May Attempt to Keep Rising
Although the overall sentiment in the Polygon (ex-MATIC) market still appears bearish, there are signs that bulls may emerge. Trading activity continues to stay below the middle band of the Bollinger Bands, and volatility remains low. Despite this, price action has not dropped below the support level formed by the floor of the falling wedge triangle on the chart.
The falling wedge pattern suggests a potential bullish breakout may occur soon. Additionally, the Stochastic RSI indicator lines are rising toward the 20 level, further signaling a possible upward move in the market. Traders can anticipate an upside shift in this market.
Polygon (ex-MATIC) Price Prediction: POL/USDT Bullish Signs Aligning (4-Hour Chart)
On the Polygon (ex-MATIC) 4-hour chart, signs of bullish momentum are appearing. The most recent price candle is green and positioned above the middle limit of the Bollinger Bands. Additionally, the last few candles are aligning just above the middle limit of the Bollinger Bands. Meanwhile, the Stochastic RSI lines are in the overbought region and appear to be approaching a bullish crossover.
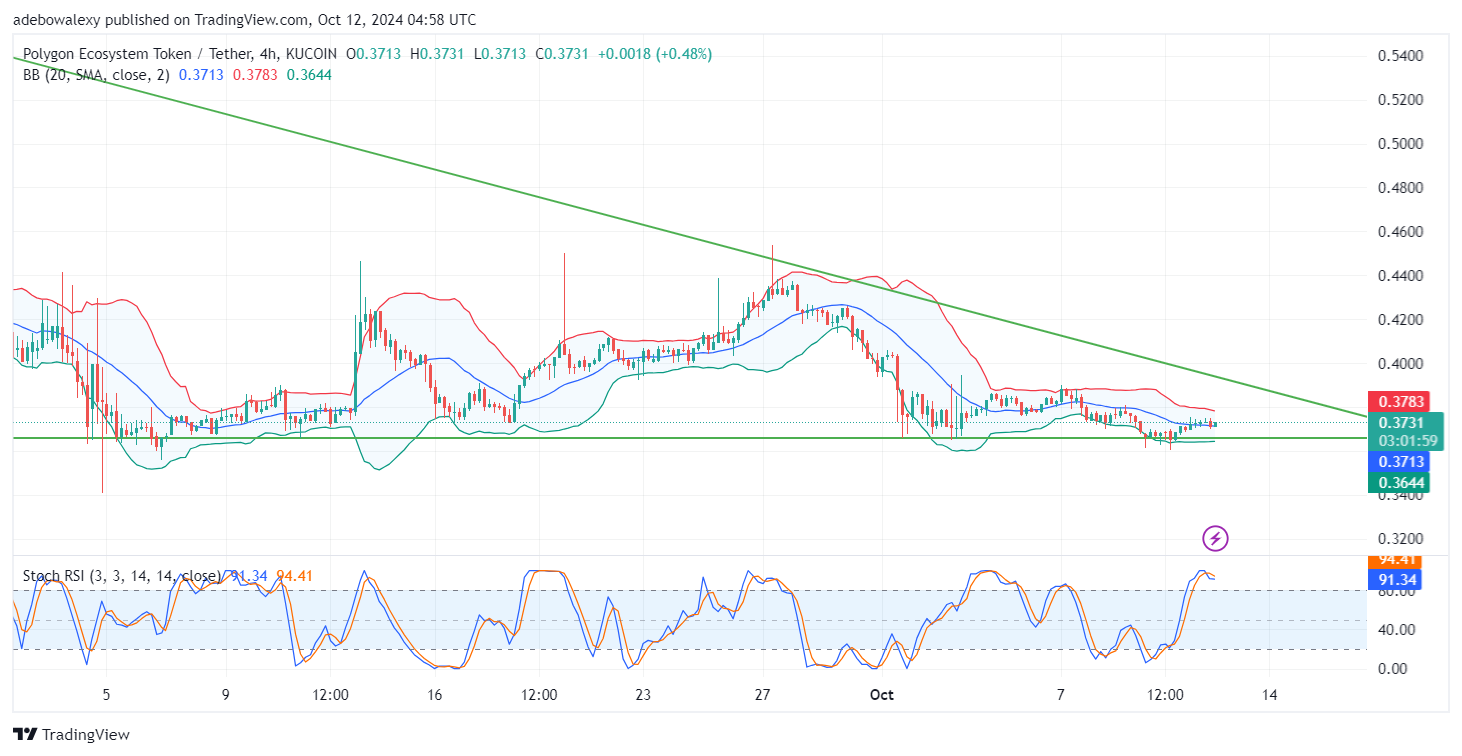
Technically, this aligns with the recent price candle positions on the 4-hour chart, suggesting that upside forces may trigger a breakout. However, since the situation is still developing, we can only speculate that a price breakout above the $0.4000 resistance level may be forthcoming.