Litecoin (LTC) Price Prediction: LTC/USDT Dips After Hitting the $80.00 Resistance
Estimated Reading Time: 3 minutes
Don’t invest unless you’re prepared to lose all the money you invest. This is a high-risk investment and you are unlikely to be protected if something goes wrong. Take 2 minutes to learn more
Recently, the Litecoin market has been seeing a considerable price increase. This started when the market rebounded off the support around the $50 mark. The market corrected upwards through multiple resistance levels afterward but currently faces rejection at the $80 price level.
LTC/USDT Long-Term Trend: Bearish (Daily Chart)
Key Price Levels:
Resistance: $80.00, $90.00, $100.00
Support: $70.00, $60.00, $50.00
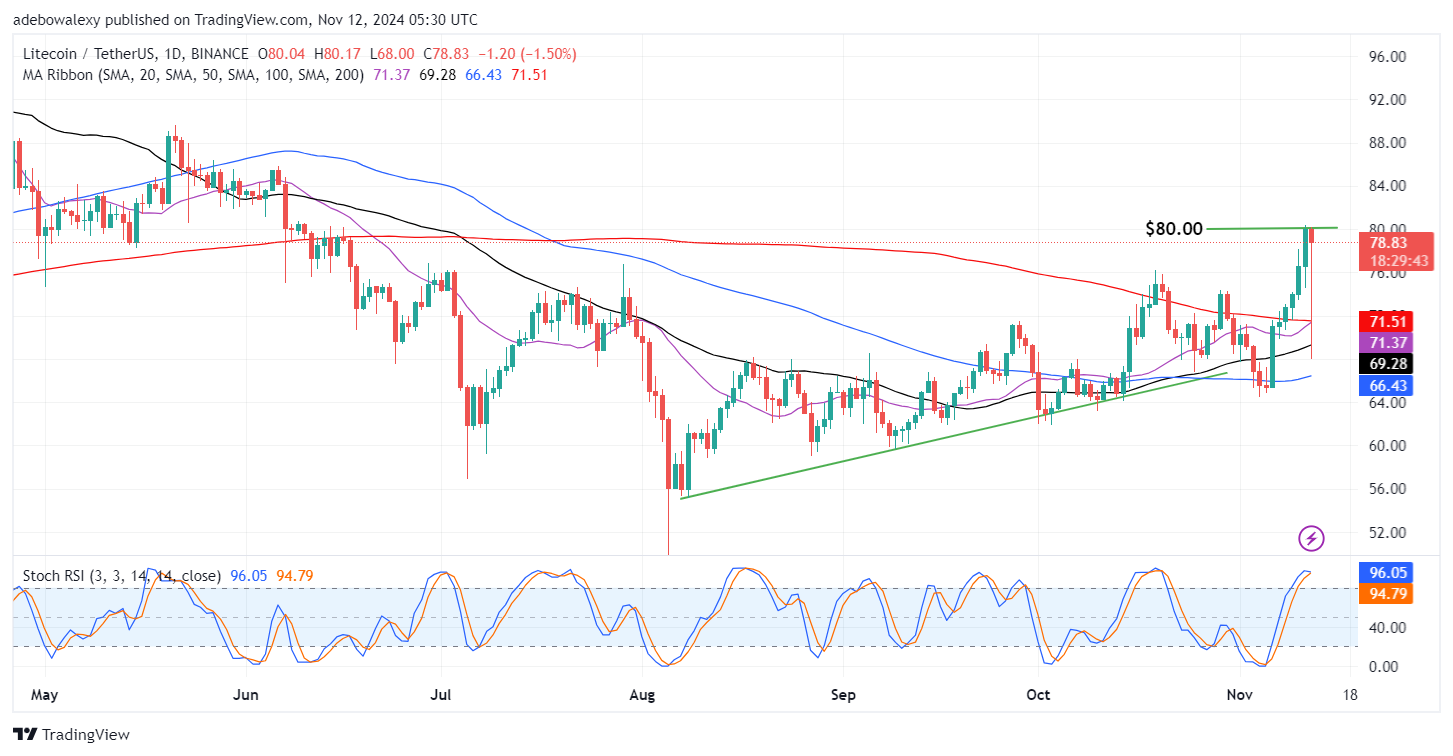
As earlier stated, it could be seen that price action had rebounded off the $80 price level in the previous session. The mentioned session ended with bulls keeping almost 100% of the recorded gains. However, the current session has appeared bearish and presented a pullback off the $80 resistance level. Nevertheless, trading continues above all the Moving Average (MA) lines on the daily chart, while the Stochastic Relative Strength Index (RSI) lines can be seen in the overbought region but at a convergence.
Litecoin (LTC) Price Prediction: LTC/USDT Bullish Correction Sees a Pause
Litecoin has been seeing some impressive upside correction ever since the bull run commenced following the US presidential election. As a result, the price increased from support around the $65 level till it hit the $80 mark in the previous session. The ongoing session has produced a downward retracement off the straight bullish path over the previous sessions.
Despite this, the token still trades above all the MA lines. This maintains the hope that the trend may resume shortly. It can also be perceived that though the Stochastic RSI lines are in the overbought region, they are at a crossover. The lines of this indicator are converged for a bearish crossover. Nevertheless, this pullback may still be shaken off easily, and the upward correction may resume.
Litecoin (LTC) Price Prediction: Bullish Hopes Stay on in the LTC/USDT Market (4-Hour Chart)
The Litecoin 4-hour market has revealed that the downward retracement has progressed. Here, the last two price candles can be seen appearing bearish, with the last one having a long lower shadow. Similar to what was observed on the daily chart, price action remains above all the MA lines. Also, the Stochastic RSI lines can be seen delivering a bearish crossover, with the ensuing lines now falling toward the 50 mark of the indicator.
Despite all the indications on this chart, it does seem that the market has a short-term bearish trajectory. This opinion stems from the position of the last price candle above all the MA lines. Also, the lines of the last price candle on the chart have a long lower shadow, showing that upward forces have staged a strong rejection of further price declines. Consequently, it appears that this market may soon continue through the $80 resistance price level. This may take the market toward the $82 mark.