Ethereum Falls Sharply as It Revisits the $1,503 Low
Estimated Reading Time: 2 minutes
Don’t invest unless you’re prepared to lose all the money you invest. This is a high-risk investment and you are unlikely to be protected if something goes wrong. Take 2 minutes to learn more

Ethereum Price Long-Term Analysis: Bearish
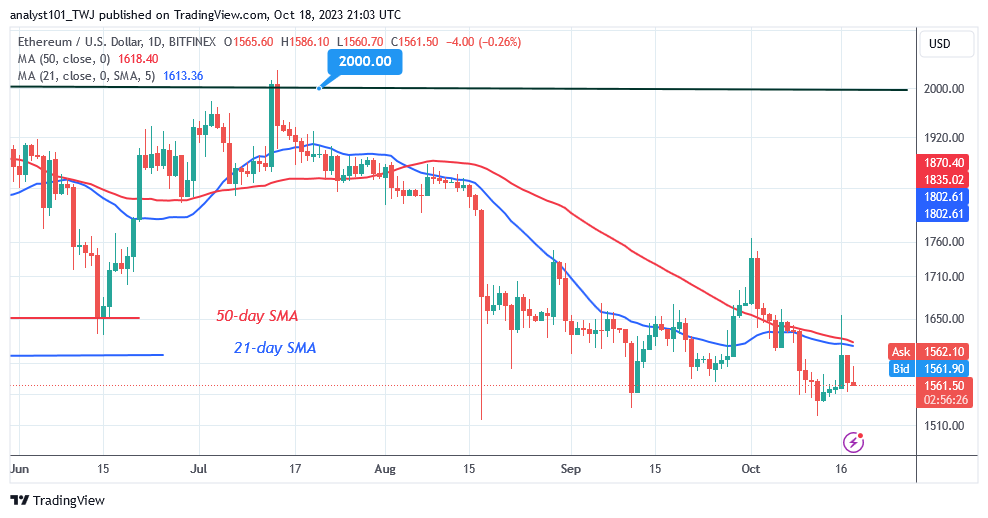
The price of Ethereum (ETH) has returned to the bearish trend zone as it revisits the $1,503 low. The largest altcoin soared to a high of $1,765 but was unable to maintain the bullish trend. Ether fell precipitously below the moving average lines. This is the second rejection at the same level. On August 29, the altcoin suffered a similar rejection and fell to a low of $1,532.
At the time of writing, Ether is trading at $1,569.80 in the current bear market. Today, the bullish momentum is being repelled again at the $1,584 high. The previous lows of $1,521 and $1,532 for ETH/USD will be revisited.
Technical indicators:
Major Resistance Levels – $2, 600, $2,80T0, $3,000
Major Support Levels – $1.600, $1, 400, $1,200
Ethereum Indicator Analysis
The price bars are below the moving average lines, accelerating the cryptocurrency’s downward trajectory. Ether is retracing on October 16 as it faces rejection at the moving average lines. Moving average lines slant downward in the opposite direction.
Conclusion
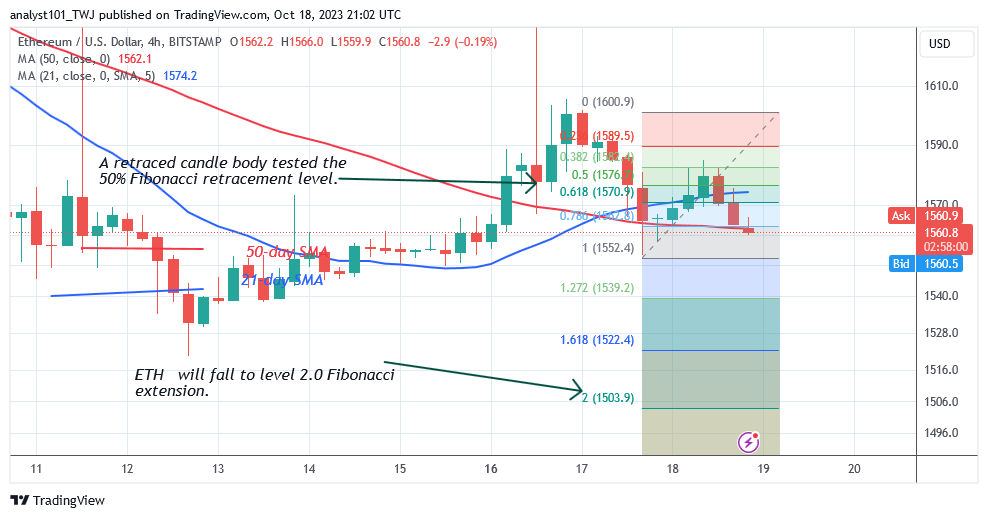
Ethereum’s price has dropped again, breaking below the moving average lines as it revisits the $1,503 low. The price signal indicates that Ether will continue to fall. After a price drop on October 17, Ether made an upward reversal and a candle body tested the 50% Fibonacci retracement level. The correction predicts that ETH will fall below the Fibonacci extension level of 2.0, or $1,503.90.
You can buy crypto coins here. Buy LBLOCK
Note: Cryptosignals.org is not a financial advisor. Do your research before investing your funds in any financial asset or presented product or event. We are not responsible for your investing results