Ethereum Reaches Bearish Exhaustion as It Holds Above $1,548
Estimated Reading Time: 2 minutes
Don’t invest unless you’re prepared to lose all the money you invest. This is a high-risk investment and you are unlikely to be protected if something goes wrong. Take 2 minutes to learn more

Ethereum Price Long-Term Analysis: Bearish
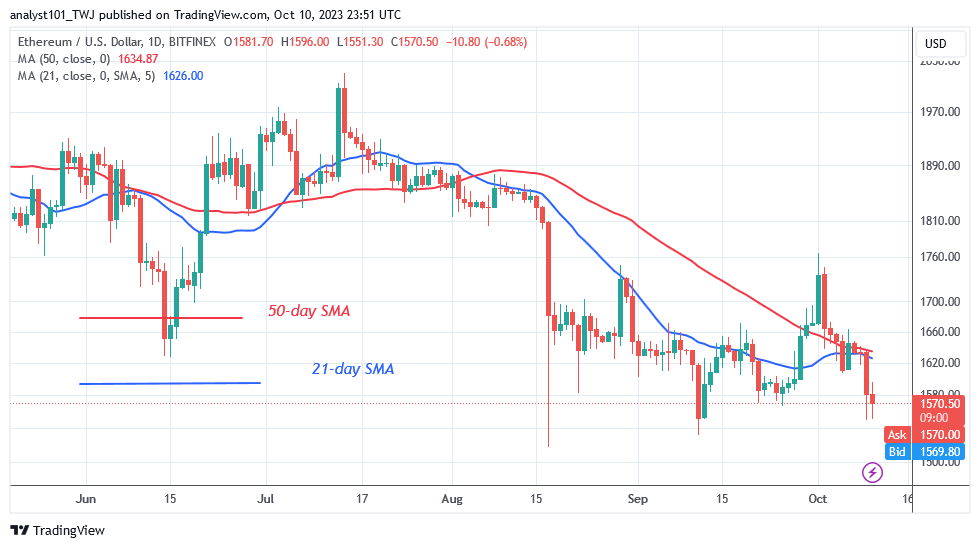
Ethereum’s (ETH) price has dropped to the bottom of the chart as it holds above $1,548. The most popular altcoin dropped from a high of $1,765 to a low of $1,551. The market has hit its limit of bearishness. The previous low of $1,517 is being revisited by the bears. At the time of writing, the price of Ether is $1,568.80.
Bulls purchased the dips, causing Ether to drop to a low of $1,551 on October 10. ETH/USD is consolidating above the $1,560 support despite its recovery. Ether has fallen to the oversold region of the market. In the oversold area, buyers should be expected as selling pressure eases.
Technical indicators:
Major Resistance Levels – $2, 600, $2,800, $3,000
Major Support Levels – $1.600, $1, 400, $1,200
Ethereum Indicator Analysis
The price of Ethereum has dropped as it once again fell below the moving average lines. The moving average lines had been sloping horizontally since August 17, indicating a sideways movement. With Doji candlesticks near the bottom of the chart, the cryptocurrency is trading only slightly.
Conclusion
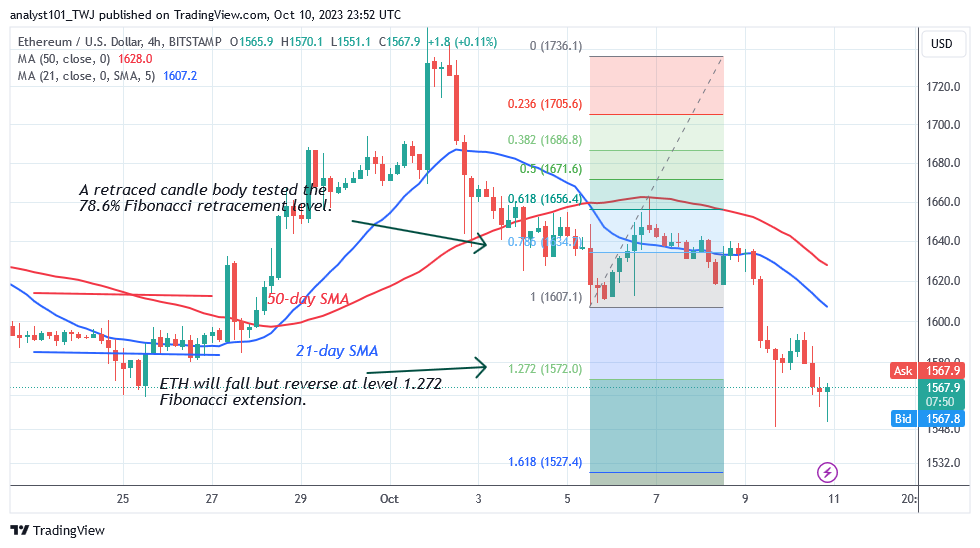
Ethereum has tested the price fall from September 11 as it holds above $1,548. Price has been stable above the $1,500 support level. According to the price indication, Ether will fall but turn around at the 1.272 Fibonacci extension level, or $1,570.10. Bulls bought the dips, as indicated by the price movement, which led Ether to drop to a low of $1,548.
You can buy crypto coins here. Buy LBLOCK
Note: Cryptosignals.org is not a financial advisor. Do your research before investing your funds in any financial asset or presented product or event. We are not responsible for your investing results