Ethereum Descends as It Hovers Above the $1,643 Low
Estimated Reading Time: 2 minutes
Don’t invest unless you’re prepared to lose all the money you invest. This is a high-risk investment and you are unlikely to be protected if something goes wrong. Take 2 minutes to learn more

Ethereum Price Long-Term Analysis: Bearish
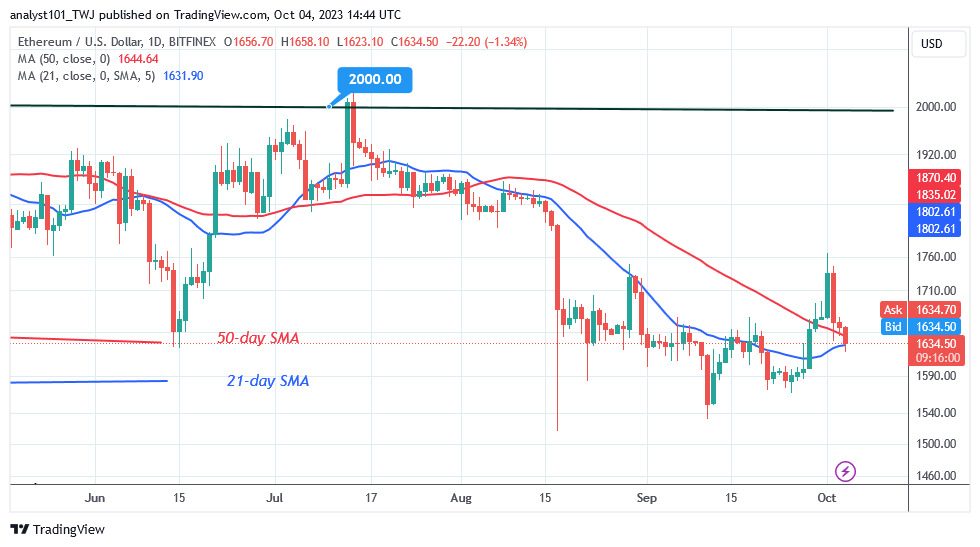
Ethereum’s (ETH) price is falling as it hovers above the $1,643 low. The current high on October 1 marked the end of the upward correction, which caused the coin to sink above the moving average lines. At the time of writing, the altcoin had reached a low of $1,644 today. On the downside, the rising movement will resume if Ether descends and maintains above the moving average lines.
The resistance of $1,740 will be tested again as the coin rises. The market will return to the previous bottom at $1,570 if Ether drops below the moving average lines. The altcoin is currently trading above the moving average lines.
Technical indicators:
Major Resistance Levels – $2, 600, $2,800, $3,000
Major Support Levels – $1.600, $1, 400, $1,200
Ethereum Indicator Analysis
The price of Ether will rise if the current support holds. When the price bars are above the moving average lines, the coin will increase in value. The decreasing slope of the moving average lines indicates a decline. If the moving average lines are tampered with, Ether risks decrease.
Conclusion
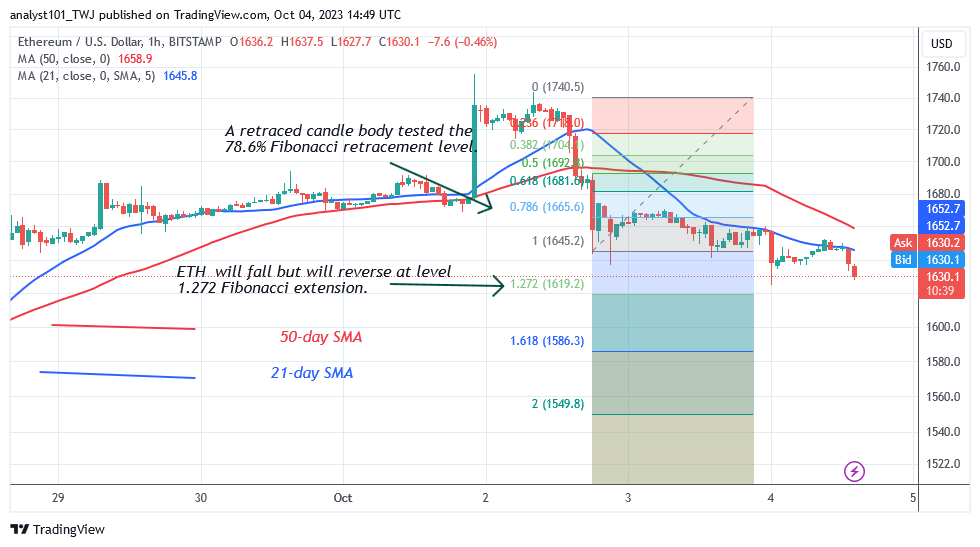
The largest altcoin is currently moving sideways in the shorter time frame but hovers above the $1,643 low. It varies between $1,620 and $1,680 levels. The price indicator predicts that the altcoin will fall but then rise to a level of $1,619.20. According to the price movement, Ether has previously retested the $1,625 and $1,627 levels of support before bouncing back.
The oversold area of the market has been reached by the cryptocurrency asset. Buyers can be drawn to cheaper price points.
You can buy crypto coins here. Buy LBLOCK
Note: Cryptosignals.org is not a financial advisor. Do your research before investing your funds in any financial asset or presented product or event. We are not responsible for your investing results