Bitcoin (BTC/USD) Trade Depresses, Attempting to Average $29,000
Estimated Reading Time: 3 minutes
Don’t invest unless you’re prepared to lose all the money you invest. This is a high-risk investment and you are unlikely to be protected if something goes wrong. Take 2 minutes to learn more
Bitcoin Price Prediction – August 16
As of the writing of this technical analysis, the BTC/USD market bears appear to be at the top of pushing, given the crypto trade depresses, attempting to average the support line of $29,000.
With 320.69 currently left over after continuous selling activity, the retracement appears to be moving in the direction of the value line’s threshold. The decrease transaction has a weak force that is less inclined to participate in the shorting process. By launching a purchase limit order later, buyers may be getting set closely beneath the point.
BTC/USD Market
Key Levels:
Resistance levels: $30,000, $31,000, $32,000
Support levels: $29,000, $28,000, $27,000
BTC/USD – Daily Chart
The BTC/USD daily chart reveals that the crypto-economic trade depresses, attempting to average the support level of $29,000.
Being as it has been trending, the current formation of a smaller bearish candlestick portends that about 25% or a bit less will be the remaining value that the market may go further reducing as the 14-day SMA indicator is at $28,883.15 underneath the $29,694.93. The Stochastic Oscillators are positioned southbound, maintaining points between 27.03 and 19.40.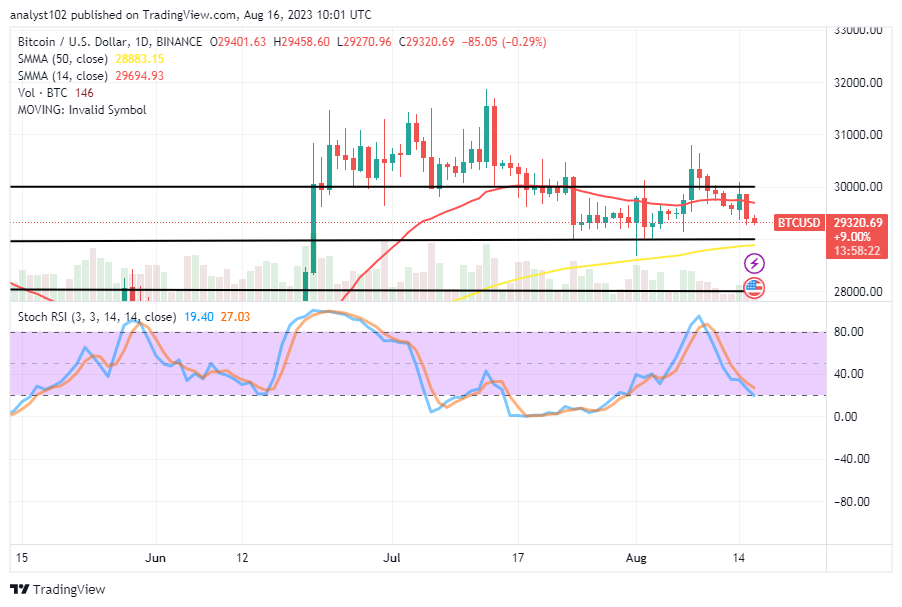
Should investors in the BTC/USD market launch their products before the price retests the $29,000 support line?
The obtainable psychological trade thought in the BTC/USD market operations suggests that investors can start adding to their portfolio sizes as the crypto-economic trade depresses, attempting to average the support zone of $29,000.
Long-term position orders might have to be suspended at this point to allow a test of support to occur, possibly around the trend line of the bigger Moving average, before considering launching buy orders afterward.
Because the Oscillators’ reading posture indications showed lower figures to complete it perhaps in the near future, it appears that it was too late to join the downward force even at its current rate of trading. To prevent any potential whipsaw session against any current intended shorting order, that presumption should be maintained. 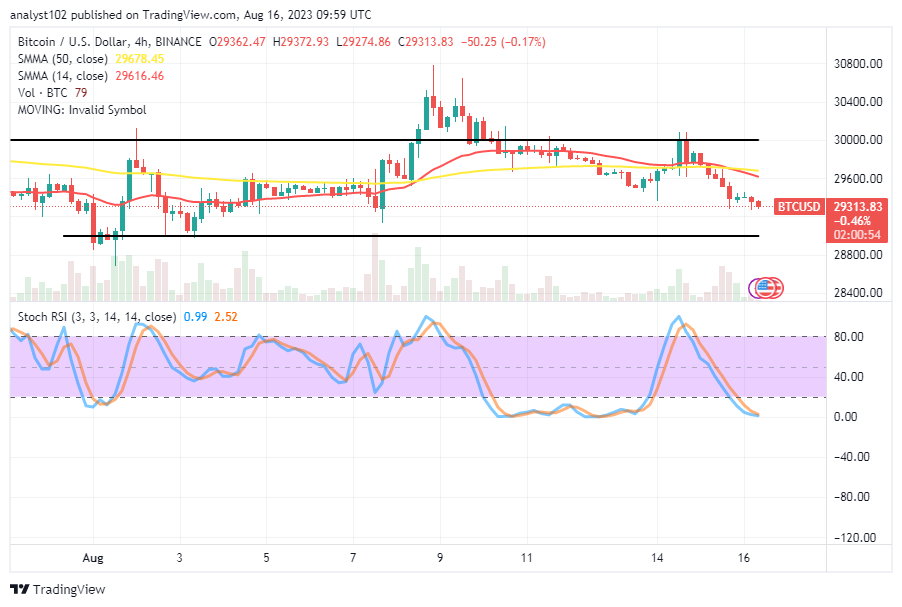
BTC/USD 4-hour Chart
The BTC/USD 4-hour chart shows the crypto trade depressed, attempting to average the support level of $29,000.
The 50-day SMA trend line has been crossed by the 14-day SMA trend line to the south, making the bigger indicator to place at $29,678.45. The Stochastic Oscillators are in the oversold region, keeping the point lines between 2.52 and 0.99. That signifies that the fallout situation is rapidly approaching an end. Therefore, sellers should be cautious about pushing more than necessary through the underlying baselines.
Note: Cryptosignals.org is not a financial advisor. Do your research before investing your funds in any financial asset or presented product or event. We are not responsible for your investing results.
You can purchase Lucky Block here. Buy LBLOCK