Arbitrum Price Prediction: ARB/USD Bears Could Demolish $1.15 Support
Estimated Reading Time: 3 minutes
Don’t invest unless you’re prepared to lose all the money you invest. This is a high-risk investment and you are unlikely to be protected if something goes wrong. Take 2 minutes to learn more
Arbitrum Price Prediction – July 25
The Arbitrum price prediction shows that ARB keeps trading below the moving averages as the coin touches $1.15 support.
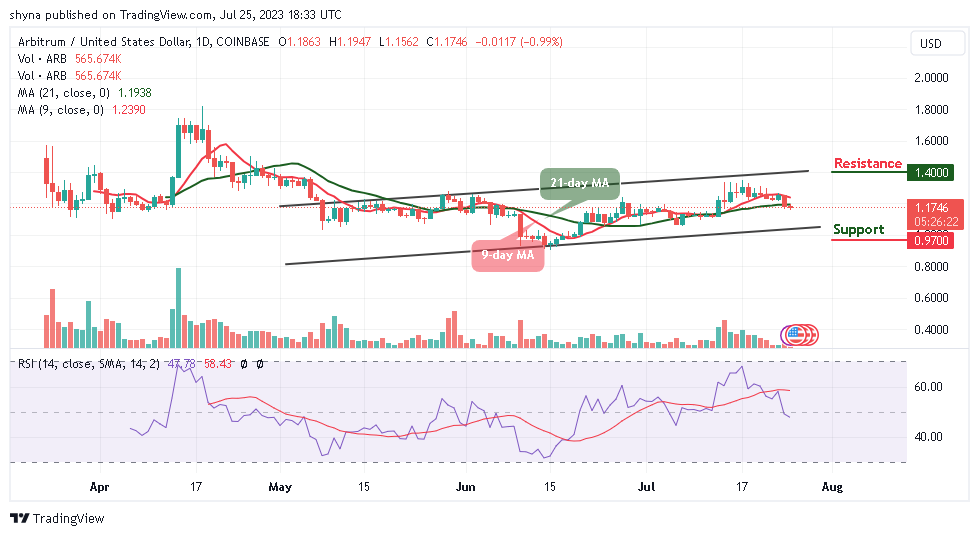
ARB/USD Long-term Trend: Ranging (Daily Chart)
Key levels:
Resistance Levels: $1.40, $1.42, $1.44
Support Levels: $0.97, $0.95, $0.93
ARB/USD is currently facing a setback as this could be a permanent one. The coin is likely to have a bearish run in the short term, but a price rally may help the coin to head to the south of the red line of the 9-day moving average and cross below the green line of the 21-day moving average. Currently, Arbitron (ARB) is trading around the $1.17 level after a free fall from $1.19 during the European session.
Arbitrum Price Prediction: Arbitrum (ARB) May Head Below the Moving Averages
Looking at the daily chart, the Arbitrum price is currently nose-diving below the 9-day and 21-day moving averages. If the price should slump below the support level of $1.15, it is likely to face a downward trend. However, further bearish movement could locate the supports at $0.97, $0.95, and $0.93, making room for ARB to fall even further.
In the meantime, the technical indicator Relative Strength Index (14) is crossing below the 50-level as trading volume could be in support of the bears. Moreover, if the bulls decide to move the price above the 9-day and 21-day moving average, ARB/USD may likely cross above the upper boundary of the channel to locate the resistance levels at $1.40, $1.42, and $1.44.
ARB/USD Medium-Term Trend: Ranging (4H Chart)
On the 4-Hour chart, the Arbitrum price stays below the 9-day and 21-day moving averages, and the immediate support is likely to come at the $1.14 level. The price may likely fall below this level if the bears fully stepped back into the market.
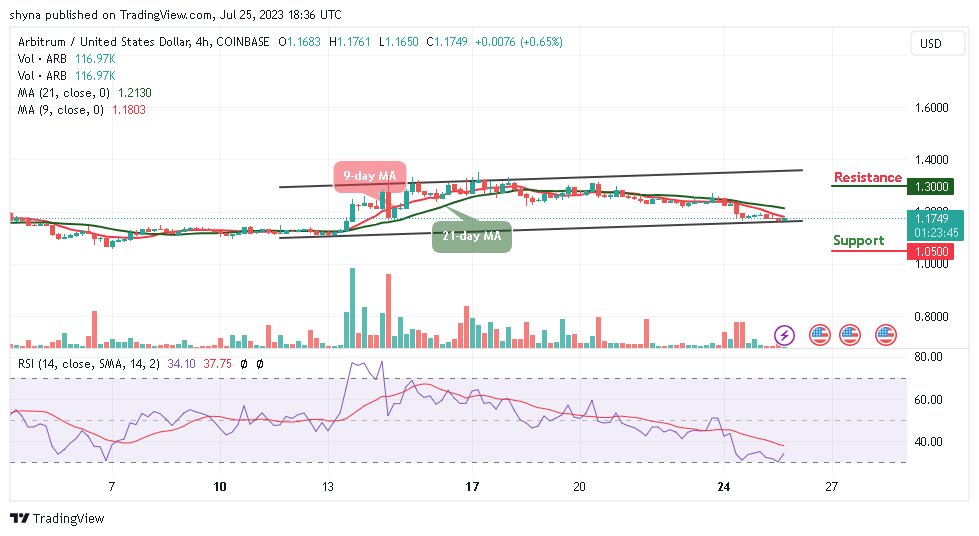
However, a further bearish movement could test the critical support at the $1.05 level and below, while the resistance is located above the moving averages at the resistance level of $1.30 and above. Technically, Arbitrum is currently moving within the negative side as the technical indicator Relative Strength Index (14) remains below the 40-level.
Place winning Arbitrum trades with us. Get ARB here