Solana (SOL) Price Prediction: SOL/USDT Respects the Resistance at the $185.00 Mark
Estimated Reading Time: 3 minutes
Don’t invest unless you’re prepared to lose all the money you invest. This is a high-risk investment and you are unlikely to be protected if something goes wrong. Take 2 minutes to learn more

Solana (SOL) Price Prediction: July 26
Last week, the Solana token traded above the $165 mark. The market showed upside potential, which was realized as soon as BTC started gaining traction. Currently, this token trades above the $180 mark while eyeing even higher price levels.
SOL/USDT Long-term Trend: Bullish (Daily Chart)
Key Price Levels:
Resistance Levels: $185.00, $190.00, and $200.00
Support Levels: $170.00, $160.00, and $150.00
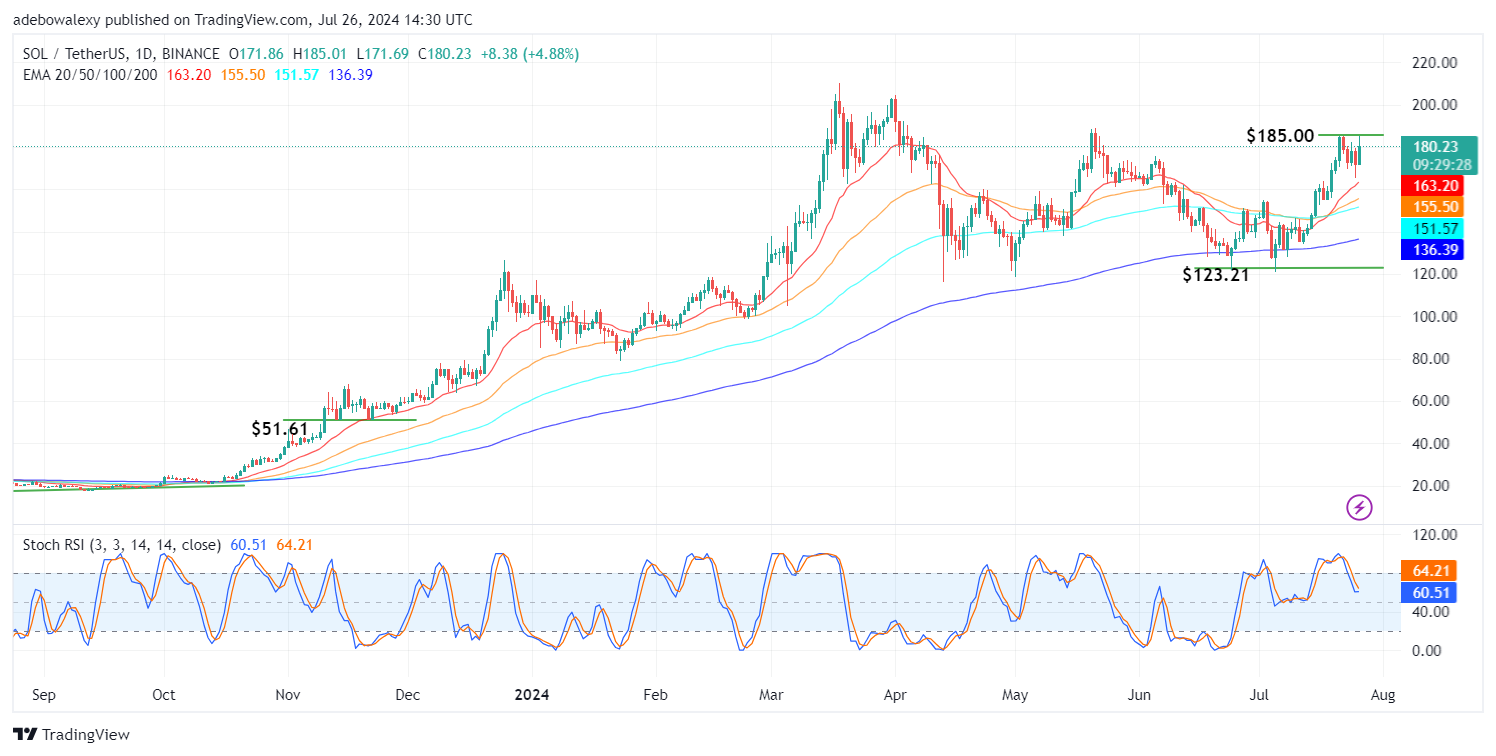
Solana continues to trade above all the Exponential Moving Average (EMA) lines. However, the price of the token has contracted off the technical resistance at the $185.00 mark in today’s trading activities. Nevertheless, buyers are still holding tight to considerable gains in the session. Meanwhile, the Stochastic Relative Strength Index (SRSI) can be seen attempting a bullish crossover just above the 50 level of the indicator.
Solana Price Prediction: SOL/USDT Price Action May Soon Break the $185 Resistance
Considering the position of price activity on the Solana daily price chart, we can see that the market has upside potential. Although the market can be seen to have tested the resistance at the $185 mark, the last candle has contracted downwards, showing that downward forces are mounting some resistance to upside progress.
Meanwhile, we can see that the SRSI lines are still above the 50 level of the SRSI indicator. Also, the lines of this indicator can be seen to be attempting a bullish crossover. Should an upside force be able to affect the crossover, the market may break through the resistance staged by downward forces.
SOL/USDT Medium-term Trend: Solana Stays Promising Above the EMA Lines (4H Chart)
Price action in the SOL/USDT market remains positioned above all the EMA lines even in a shorter time-framed market. However, the ongoing session shows that price movement has come under a considerable amount of downward pressure. Consequently, the resistance at the $185 mark stays intact. Additionally, the SRSI indicator lines can be seen rising through the 80 level of the indicator.
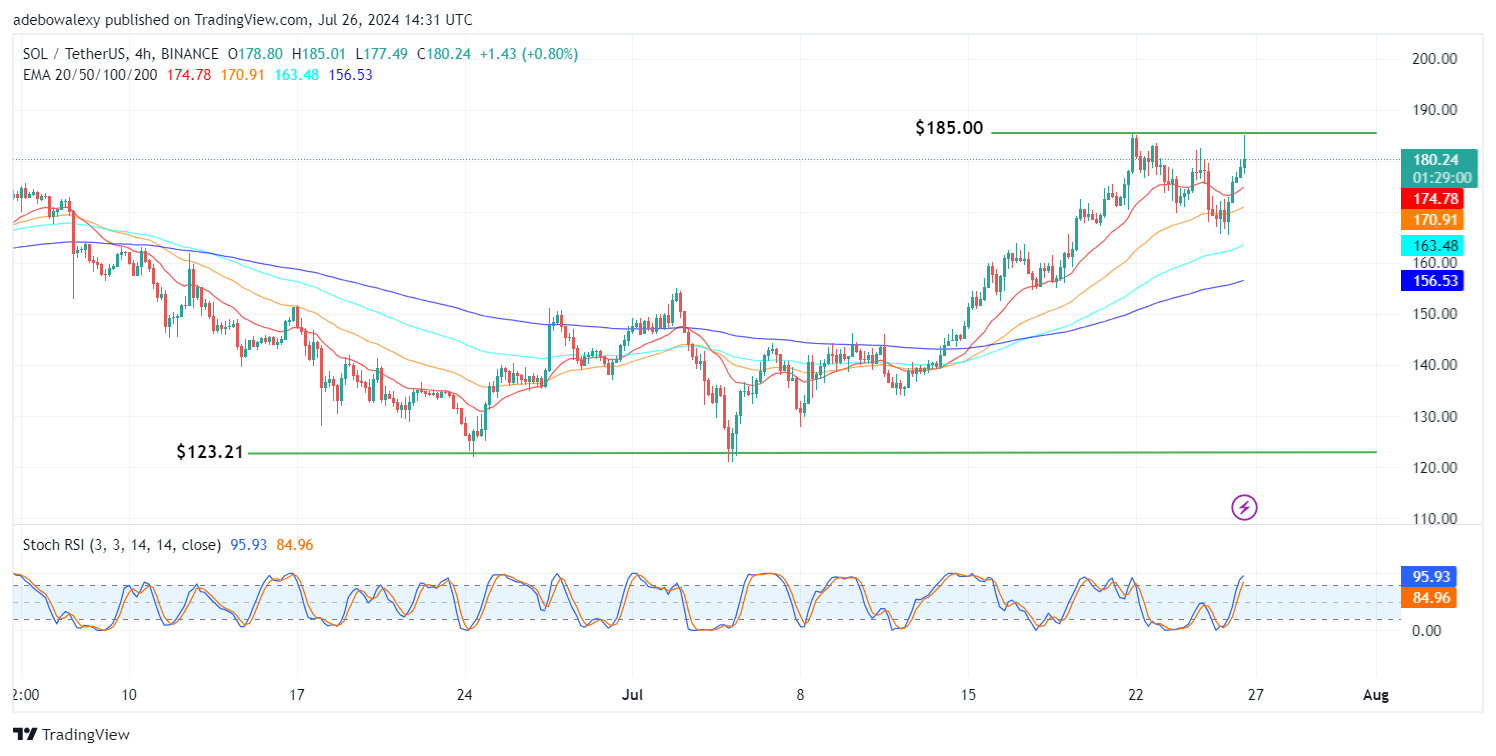
Meanwhile, the leading line of this indicator seems a bit deflected due to the downward compression. Nevertheless, the lines of this indicator can be seen maintaining a general upside orientation. Going by available signs in this market, it could be seen that prices may still break the resistance at the $185 mark despite the current challenge being faced.