Ethereum (ETH/USDT) Attempts Recovery Despite Market Situation
Estimated Reading Time: 3 minutes
Don’t invest unless you’re prepared to lose all the money you invest. This is a high-risk investment and you are unlikely to be protected if something goes wrong. Take 2 minutes to learn more
Ethereum Long-term Analysis: Bearish
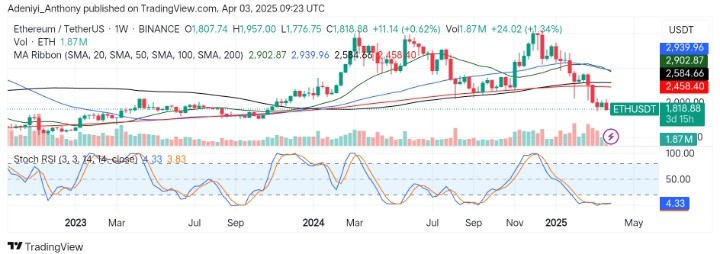
The market condition for Ethereum against the Tether has experienced a prolonged correction period, slicing through supports in recent times. However, the current candlestick suggests a potential recovery attempt as buyers look to regain momentum.
Before now, the pair has faced a strong rejection after reaching highs above $3,000, leading to a slope towards the south and correcting below key moving averages. However, the Stochastic oscillator below the chart shows the pair is showing early signs of recovery.
Currently, Ethereum trades at $1,818.88, with a moderate traded volume of 1.87 million for the week already.
Technical Indicators
Major Resistance Levels: $1,935.00, $2,000.00, and $2,584.00
Major Support Levels: $1,788.00, $1,700.00, and $1,500.00
Ethereum Technical Analysis
The analysis of Ethereum against the Tether on a weekly timeframe shows that the pair has been under prolonged bearish pressure since dropping from above $3,000 in recent times. The pair appears to be operating under the 50-day moving average, suggesting the bears are still in control of the market. However, the current candle shows the bulls are attempting a move to the north as the market sees a 0.62% gain for the week.
Beneath the chart, the Stochastic RSI, despite being in an oversold region, signals a recovery towards the immediate resistance level at $1,900. However, the positioning of the lines indicates this move is still young, and caution is needed.
To this end, a recovery would be confirmed with an improvement above the 20-mark level, and momentum can be maintained above the $1,900 level; otherwise, the pair might face further bearish pressure.
ETH/USDT Analysis: What’s Next?
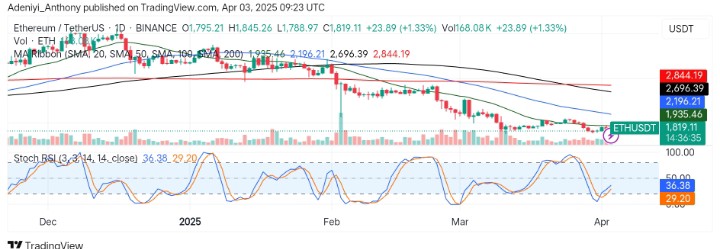
On the daily timeframe, ETH/USDT appears to form a solid base around $1,800, preventing further southeast movement. However, the pair’s price remains under the moving averages, suggesting an improvement with waning bearish pressure.
From another angle, the oscillator suggests a mild bullish recovery as the blue line advances toward the 40-mark level. However, with a gain of 1.33%, more movement towards the 50-mark level would cement an upside movement.
To this end, if ETH can hold the $1,800 and reclaim the $1,935, a recovery towards the $2,000 would be possible; otherwise, a break below this level might suggest a continued downtrend.
You can purchase crypto coins here. Buy LBlock