Ethereum (ETH/USDT) at a Critical Juncture: Rebound or Further Decline?
Estimated Reading Time: 3 minutes
Don’t invest unless you’re prepared to lose all the money you invest. This is a high-risk investment and you are unlikely to be protected if something goes wrong. Take 2 minutes to learn more
Ethereum Long-term Analysis: Bearish
The market for Ethereum against the Tether has been under noticeable price pressure some months, reflecting a bigger market correction. However, the pair’s price has seen a minor increase after falling from $2,400, displaying overall bearish momentum.
Recently, the market remains indecisive, with long-term holders remaining optimistic while short-term traders are cautious as the pair struggles to regain key support levels. However, the Guppy Multiple Moving Averages (GMMAs) and other indicators on the chart show that Ethereum is at a make-or-break level, suggesting a potential breakout.
Currently, Ethereum trades at $2,033.97, recording a moderate volume of 1.34 million traded volumes.
Technical Indicators
Major Resistance Levels: $2,050.00, $2,145.00, and $2,310.00
Major Support Levels: $2,000.00, $1,997.00, and $1,850.00
Ethereum Technical Analysis
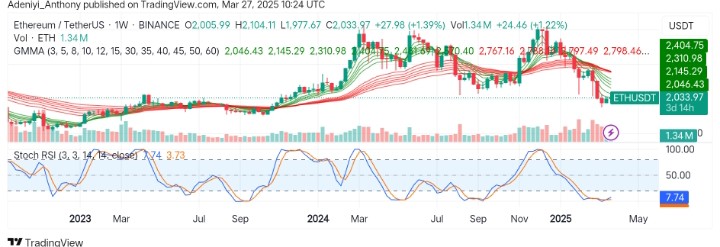
The weekly analysis of Ethereum against the Tether shows the pair is at a critical level, with mixed signals from major technical indicators. The GMMAs display a bearish crossover, as the short-period EMAs diverge and operate below the long-period EMAs.
On the other hand, the Stochastic RSI indicates an oversold condition. However, the positioning of the indicator’s lines suggests the pair might be due for a potential bounce.
To this end, a break above the $2,050 resistance level would confirm a move to the north; otherwise, stagnancy in the trading volumes would indicate a bullish struggle to break above key resistance levels.
ETH/USDT Analysis: Where from Here?
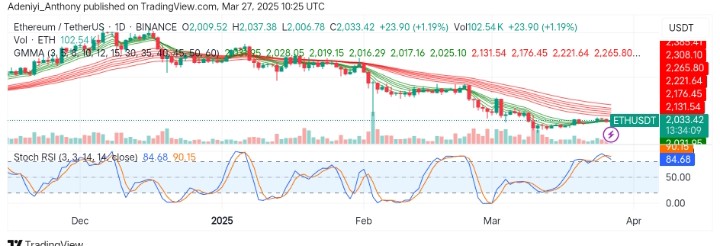
The market for ETH/USDT on a daily timeframe has been on a consistent downtrend for several weeks. However, recent price movement shows the price is set for northbound actions as the short-period EMAs prepare to cut the long-period EMAs from below, indicating bearish momentum may be slowing down.
From another angle, the oscillator beneath the chart indicates the pair is overbought and may be due for a potential retracement. To this end, the currently low trading volume suggests the ongoing uptrend lacks strong conviction. Therefore, a retracement towards the $2,000 level may be likely if ETH/USDT fails to hold above the current level.
You can purchase crypto coins here. Buy LBlock