Hyperliquid (HYPE/USDT) Awaits Bullish Reversal Amid Bearish Pressure
Estimated Reading Time: 3 minutes
Don’t invest unless you’re prepared to lose all the money you invest. This is a high-risk investment and you are unlikely to be protected if something goes wrong. Take 2 minutes to learn more

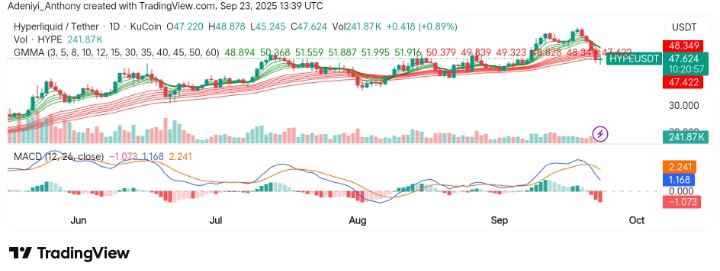
The market for Hyperliquid against Tether is leaning towards a bullish reversal after a drastic drop, as demonstrated by the current uptick. The market reflects recovery in favor of the bulls after strong sell pressure hit the market in the previous trading sessions. However, the Guppy Multiple Moving Averages (GMMA) and MACD suggest that the market is controlled by the bears.
Currently, Hyperliquid trades at $47.624, with more than 241k trade volumes already for the day.
Technical Indicators
Major Resistance Levels: $49.80, $52.50, and $55.00
Major Support Levels: $47.20, $45.30, and $43.00
Hyperliquid Technical Analysis
Over the past few weeks, Hyperliquid against Tether has been oscillating along a straight line, trending upside. However, in recent trade, the price of the pair has plummeted from above $50 to $48.
The GMMA and MACD on the daily timeframe suggest the bears’ power seems to be waning, but they are still in control. However, for the bulls to regain lost position, the price must hold above $49.50; otherwise, the bears will push the price further downward with a close below $47.20 in this current session.
$HYPE absolutely nothing to be worried with this price action.
Hyperliquid has a tendency to retrace ~20% when it reaches new ATH&39;s.
People will blame $ASTER, but it&39;s the 4th time it&39;s seen a similar retracement in the last 3 months.
Will see new ATH&39;s in the coming months. pic.twitter.com/RdB9WFC0fm
— Ardi (@AltcoinArdi) September 23, 2025
However, @AltcoinArdi has suggested that there is nothing to be bothered about. The message of the post indicates a slight pullback, which will likely be followed by a recovery.
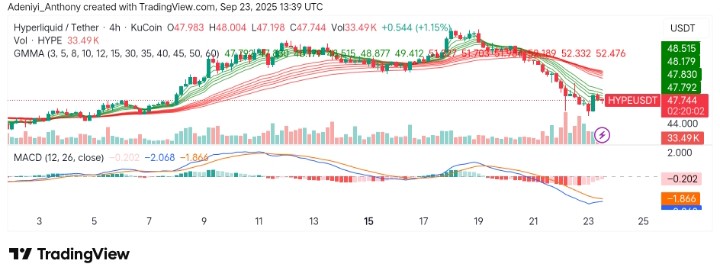
HYPE/USDT Analysis: Will Bearish Momentum Continue into October?
HYPEUSDT on the 4H chart shows that the pair’s price has experienced a drop in value and is now building a base for a bullish recovery. Also, the MACD signals of bearish pressure seem to be waning, and a crossover of the lines over the signal line would confirm a bullish reversal.
To this end, the price may continue a sideways movement at this point if the immediate resistance at $49 remains intact.
You can purchase crypto coins here. Buy Crypto