Hyperliquid (HYPE/USDT) Bullish Run: Continuation or Reversal in the Making?
Estimated Reading Time: 3 minutes
Don’t invest unless you’re prepared to lose all the money you invest. This is a high-risk investment and you are unlikely to be protected if something goes wrong. Take 2 minutes to learn more

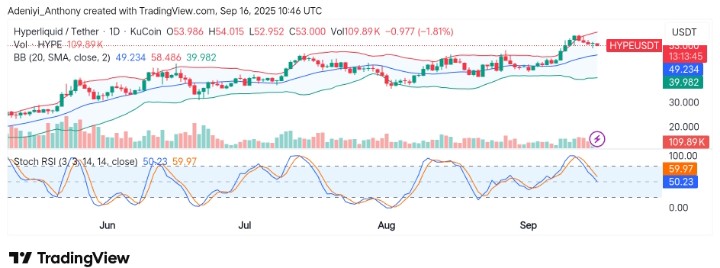
The market for Hyperliquid against Tether for some days has been showing tendencies of bullishness and bearishness after the previous week’s strong bullish rally. Looking at the recent price actions, the price has been correcting downward after the recent face-off with $54.015. As it stands, the Bollinger Bands and the Stochastic RSI appear to be giving out bearish signals, though the overall structure of the pair remains bullish. This situation suggests a neutral stance with potential for either direction.
Currently, Hyperliquid trades at $53.000, recording over 109 thousand daily traded volumes.
Technical Indicators
Major Resistance Levels: $54.015, $58.486, and $60.000
Major Support Levels: $49.234, $45.000, and $40.000
Hyperliquid Technical Analysis
Technically, the market for Hyperliquid against Tether on the daily timeframe remains bullish. At the moment, the Bollinger Bands seem to be giving away a bearish signal as the price bends to the south with expanding spaces among the lines of the indicator.
Additionally, the Stochastic RSI appears to be suggesting waning bullish momentum as the lines of the indicators operate in the neutral position, bending to the south. To this end, the volume is slightly increasing, raising concerns as to which direction the price is heading in the coming session. A move above $54.015 with the lines crossing into the overbought region would signal a continued bullish rally; otherwise, the price is heading into the $40 zone for better buying opportunities.
$HYPE – Key Buy Zones 👇
Price is currently pulling back after a strong bullish leg. We’re watching multiple high-interest zones to build a long position:
🔹 47.66 – bottom of Daily FVG, sits in discount zone of the last bullish range
🔹 42.50 / 40.00 – mid-range supports from… pic.twitter.com/HWxs6EbPpB— Hyper_Up (@hyper_updates) September 16, 2025
Noticeably, @Hyper_updates has stressed the importance of the current market scenario, stating the need to watch out for multiple interest zones. The analyst suggests a $47.66 to $40.00 support level to build a long position.
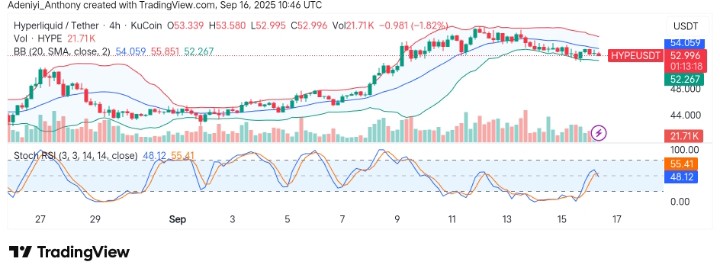
HYPE/USDT Analysis: A Short-term Correction or Another Bullish Push?
On the 4H chart, HYPE/USDT has recently retraced from its high above the dynamic 20-period moving average and is now heading to the lower limit of the Bollinger Bands. From one angle, the narrowing and bending of the bands suggest that price may face a slight correction in the coming sessions. On the other hand, the Stochastic RSI signals dropping momentum. However, the momentum oscillator suggests this correction might be a short-term move to the south.
As it stands in this timeframe, the volume remains relatively low. However, the price is still standing above the $52.267 level, indicating buying pressure can still change the narrative. To this end, a change in the direction of the Stochastic lines and a move above $53.580 would indicate another bullish push; otherwise, further correction might take place.
You can purchase crypto coins here. Buy Crypto