Tamadoge (TAMA/USD) Gearing Up Towards Breakout
Estimated Reading Time: 2 minutes
Don’t invest unless you’re prepared to lose all the money you invest. This is a high-risk investment and you are unlikely to be protected if something goes wrong. Take 2 minutes to learn more
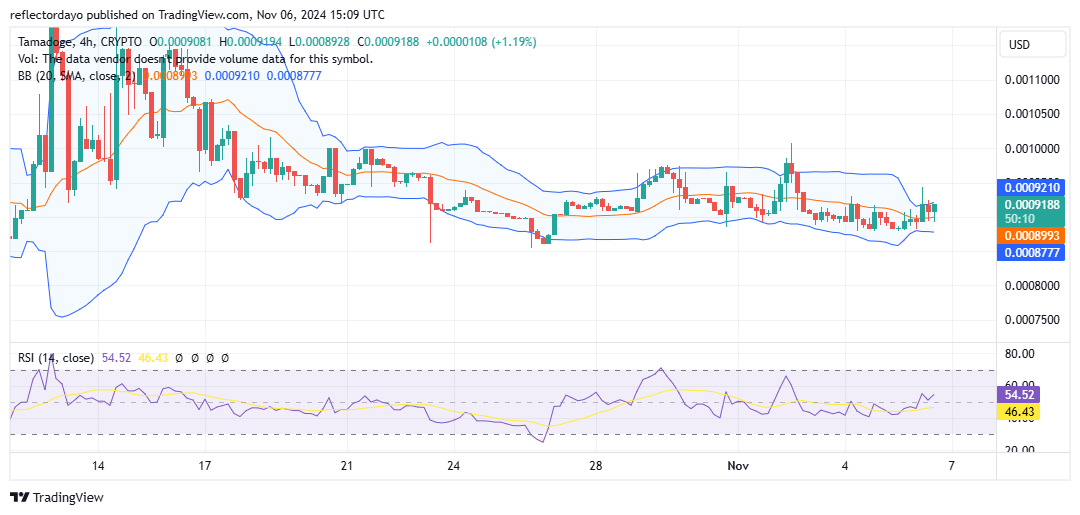
Since the market peaked at $0.001 on November 2nd and subsequently corrected, it has struggled to maintain the $0.0009 price level in the face of persistent bearish pressure. In an attempt to regain bullish momentum, the price dipped to $0.00088 to consolidate. While the Tamadoge market continues to grapple with selling pressure, recent price action suggests a potential upward trend is emerging.
Key Levels
- Resistance: $0.0013, $0.0014, and $0.0015
- Support: $0.0008, $0.00078 and $0.00074
TAMA/USD Price Analysis: The Indicators’ Point of View
One indicator of a potential price bounce is a move above the 20-day moving average. This scenario could signal a bullish breakout in the crypto market. The confluence of a strong bullish candlestick, converging Bollinger Bands, and a price above the 20-day moving average reinforces this bullish bias.
Another important factor to consider is the convergence of the Bollinger Bands. When the Bollinger Bands narrow, it typically indicates reduced volatility and a potential price breakout. If this narrowing occurs above the 20-day moving average, particularly with buyers stepping in at lower levels (as indicated by long lower shadows), it’s often a positive sign for a bullish move.
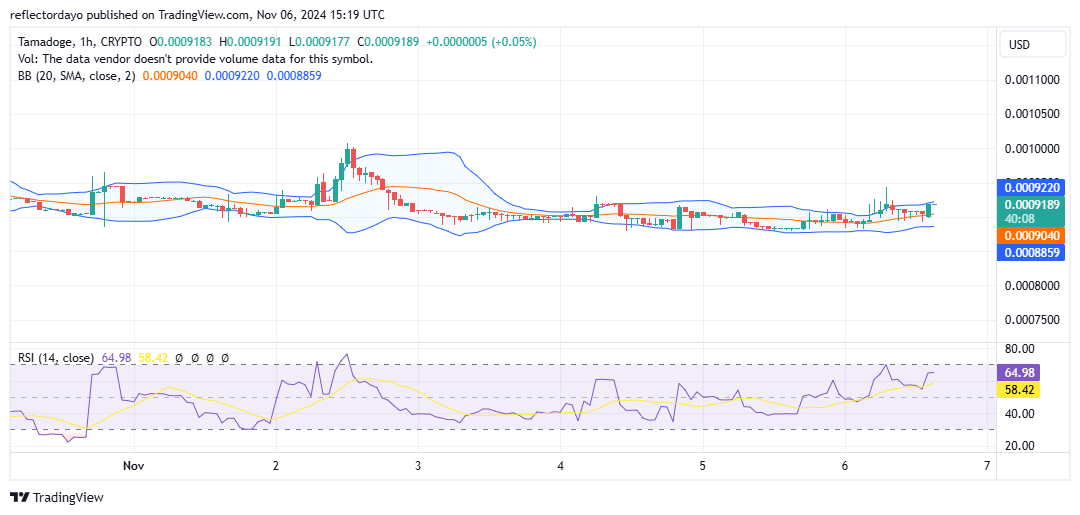
Tamadoge Short-Term Outlook: 1-Hour Chart
The 1-hour chart for Tamadoge also hints at a potential price breakout above the $0.00095 level. A recent surge above the flat 20-day moving average suggests a shift in momentum, potentially signaling a transition from a sideways or neutral market to an uptrend. This indicates increasing buying pressure. However, the upper Bollinger Band has yet to react to this development, remaining relatively flat. The direction of the market will become clearer in the upcoming trading sessions.
Buy TAMA/USD!
Fill your weekend by playing five exhilarating play-to-earn arcade games! 🕹️💰
Battle your way to the top of the weekly leaderboards and load up on $TAMA rewards!
Download on mobile now 👇
📱 Android: https://t.co/D4TjX7gTFl
📱 iOS: https://t.co/0fjJapf5oA pic.twitter.com/6MCruiKcet— TAMADOGE (@Tamadogecoin) September 13, 2024