Polygon (MATIC/USD) Market Is Hovering, Mustering Muscles
Estimated Reading Time: 3 minutes
Don’t invest unless you’re prepared to lose all the money you invest. This is a high-risk investment and you are unlikely to be protected if something goes wrong. Take 2 minutes to learn more
Polygon Price Prediction – June 18
The financial book of records reveals that the MATIC/USD market is hovering, mustering muscles that have already graduated into an unnerving trade baseline formation around the lower trading of $0.60. As the current situation has come by, Buyers would graciously possess the ability to make a line of variant upswings toward accelerating motions to the top with steadiness in the long-term run. In the light of keeping the base opportunity, pushes by bears should checkmate around the point mentioned earlier.
MATIC/USD Market
Key Levels
Resistance levels: $0.75, $0.85, $0.95
Support levels: $0.50, $0.45, $0.40
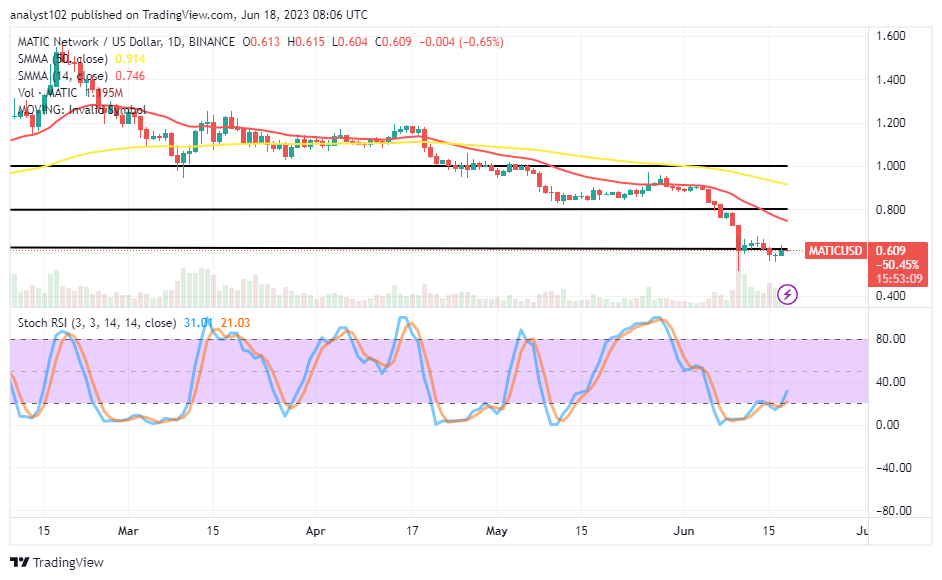
MATIC/USD – Daily Chart
It has been on the MATIC/USD daily chart that the crypto market is hovering, mustering muscles around the line of $0.60. The 14-day SMA indicator is at $0.746 below the $0.914 value line of the 50-day SMA indicator. The stochastic oscillators are moving in a consolidation pattern and are in the oversold area, obtaining 21.03 and 31.01 to the upside. Going by that reading implication sign, it means some progressions have started to coup in.
Can there be declines when bears in the MATIC/USD trade consolidate around the $0.60 level?
Expectantly, a potential consolidation moving attempt around the $0.060 without posing a close southward positioning by the 14-day SMA indicator will not gain firm stances so cheap to break downside past it as the MATIC/USD market is in a fluctuation moving mood, mustering muscles at a minute negative percentage rate of 0.65, trading at $0.609 over the low point of $0.604.In this market, purchasers need to get practice following the profits.
On the decreasing mode in the MATIC/USD market analysis, it won’t be psychologically ideal to launch a sell order position instantly around $0.60, judging by the current reading pace outlook of the Stochastic Oscillators. As for the time being, the reformation of variant trading candlesticks around the 14-day SMA trend line will have to set in to portray signs of rejection before a downward could re-take its shape decently.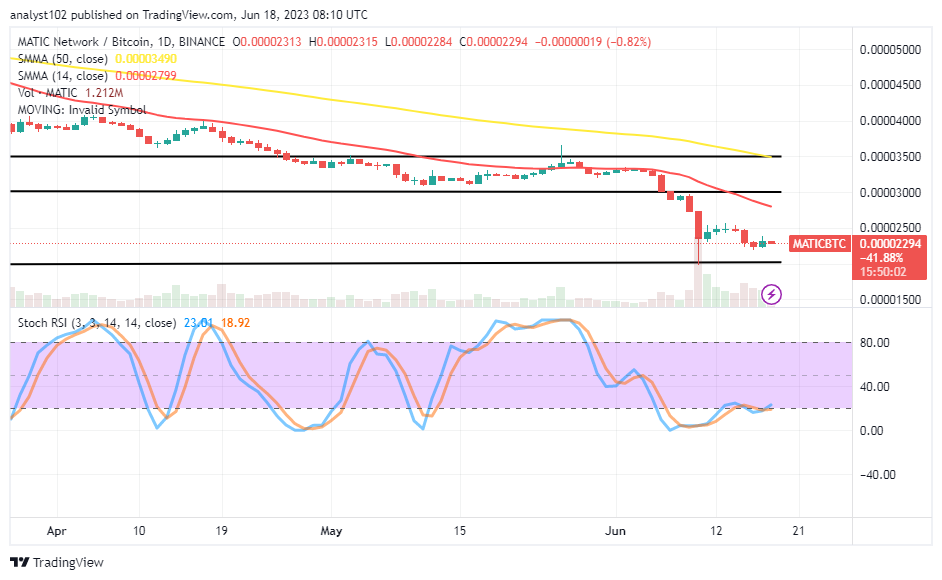
MATIC/BTC Price Analysis
In contrast, Polygon has significantly dropped against the trend capacity of Bitcoin, mustering muscles closely over the lower horizontal line drawn beneath the sell signal side of the SMAs. The 14-day SMA indicator is underneath the 50-day SMA indicator. The Stochastic Oscillators are in the oversold region, moving in consolidation to place tentatively northbound at 18.92 to 23.01 points to signal that the base crypto is struggling for recovery. It will take some time for the counter-trading instrument to reach the spot where it can finally signal a better stage to move back down, if necessary.
Note: Cryptosignals.org is not a financial advisor. Do your research before investing your funds in any financial asset or presented product or event. We are not responsible for your investing results.
You can purchase Lucky Block here. Buy LBLOCK