Polygon (MATIC/USD) Price Dumps, Observing an Infuriating Drawback
Estimated Reading Time: 3 minutes
Don’t invest unless you’re prepared to lose all the money you invest. This is a high-risk investment and you are unlikely to be protected if something goes wrong. Take 2 minutes to learn more
Polygon Price Prediction – June 11
Some trading activities have occurred in the Polygon valuation to formerly show that a base had been building around $0.80 against the trending power of the US currency has abruptly turned into a continual process, showcasing a dump to observe an infuriating drawback briefly beyond the $0.60 in about some hours back. The inability of bears to push down past the $0.592 level has resulted in an indicator of positive. Moves will now need to be able to contribute to the creation of rallies that try to recover lost assets.
MATIC/USD Market
Key Levels
Resistance levels: $0.75, $0.85, $0.95
Support levels: $0.55, $0.45, $0.35
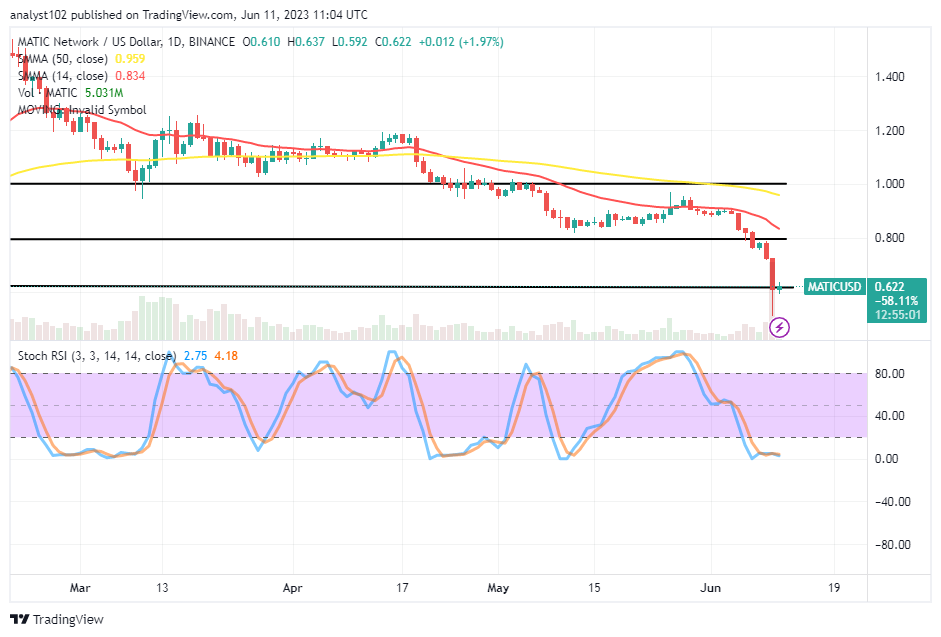
MATIC/USD – Daily Chart
It has showcased on the MATIC/USD daily chart that the crypto-economic price dumps, observing an infuriating drawback at a maximal notable lower-trading zone. The 14-day SMA trend line has curved southward at $0.834 below the $0.959 point of the 50-day SMA trend line. The Stochastic Oscillators have moved southbound from the overbought region into the oversold region. Additionally, they are still obliquely pointing downward from levels of 4.18 to 2.75 to indicate that there has been a temporary dip.
Has there any indication that the MATIC/USD market has reached a point of decrease where further, painless declines below $0.60 may not be possible?
From the technical point of view, it is that the MATIC/USD market has reached a decrease where more fearful drops beneath the $0.60 tend not to be probated as even the price has dumped, observing an infuriating drawback below the previous zone of $0.80, previously anticipated to be where a baseline would have come by. When examining the trade operation hopes from yesterday, the candlestick had a bottom shadow that bordered approximately $0.60, which had the potential to re-arrange a series of times when prices rallied in the days that followed.
On the furtherance of decreasing mode in the MATIC/USD market analysis, a respite has to be in the way bears have been dominating until a series of rises occur to encounter a potential resistance around the $0.80, aligning with the instrument of the 14-day SMA and supported by a reading of the Stochastic Oscillators around or in the overbought area to suggest a downward-direction point before starting to launch a shorting order position.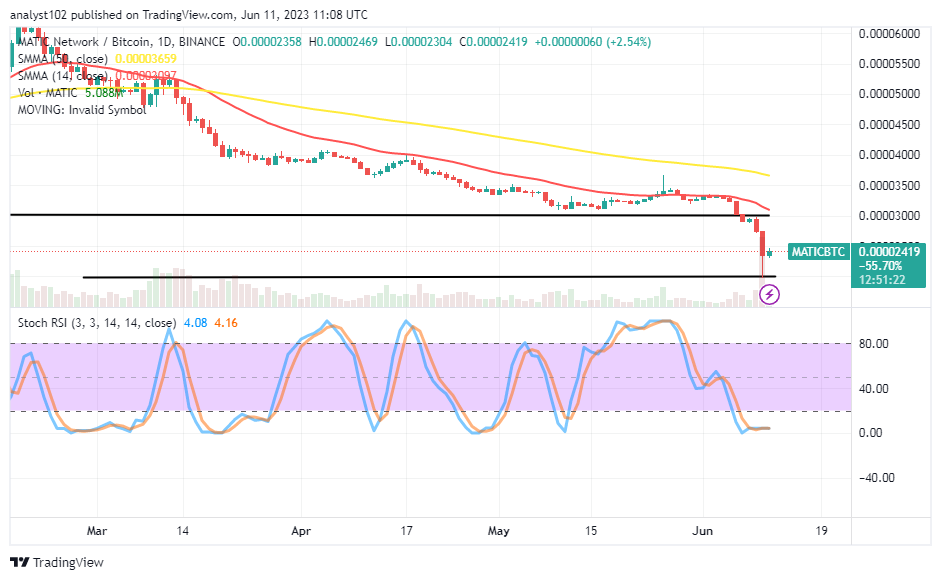
MATIC/BTC Price Analysis
In contrast, Polygon has lost momentum further against Bitcoin, as the pairing crypto economy is observing an infuriating drawback toward completing a bearish move toward a lower horizontal line drawn below the smaller SMA. The arrangement between the indicators shows that buying moments have been suppressed over the long term as the 14-day SMA lowly placed to the 50-day SMA. More importantly, the Stochastic Oscillators have dipped into the oversold region to establish a sitting set between 4.16 to 4.08 points. That portends selling forces have been reducing drastically.
Note: Cryptosignals.org is not a financial advisor. Do your research before investing your funds in any financial asset or presented product or event. We are not responsible for your investing results.
You can purchase Lucky Block here. Buy LBLOCK